UNITED STATES
SECURITIES AND EXCHANGE COMMISSION
Washington, D.C. 20549
FORM 8-K
CURRENT REPORT
Pursuant to Section 13 or 15(d)
of the Securities Exchange Act of 1934
Date of Report (Date of earliest event reported): May 1, 2014
XPO LOGISTICS, INC.
(Exact name of registrant as specified in its charter)
| Delaware | 001-32172 | 03-0450326 | ||
| (State or other jurisdiction of incorporation) |
(Commission File Number) |
(I.R.S. Employer Identification No.) |
Five Greenwich Office Park, Greenwich, Connecticut 06831
(Address of principal executive offices)
(855) 976-4636
(Registrant’s telephone number, including area code)
N/A
(Former name or former address, if changed since last report)
Check the appropriate box below if the Form 8-K filing is intended to simultaneously satisfy the filing obligation of the registrant under any of the following provisions:
| ¨ | Written communications pursuant to Rule 425 under the Securities Act (17 CFR 230.425) |
| ¨ | Soliciting material pursuant to Rule 14a-12 under the Exchange Act (17 CFR 240.14a-12) |
| ¨ | Pre-commencement communications pursuant to Rule 14d-2(b) under the Exchange Act (17 CFR 240.14d-2(b)) |
| ¨ | Pre-commencement communications pursuant to Rule 13e-4(c) under the Exchange Act (17 CFR 240.13e-4(c)) |
| Item 2.02. | Results of Operations and Financial Condition |
On May 1, 2014, XPO Logistics, Inc. (the “Company”) issued a press release announcing its results of operations for the fiscal quarter ended March 31, 2014. A copy of the press release is furnished as Exhibit 99.1 to this Current Report on Form 8-K.
The information furnished pursuant to this Item 2.02, including Exhibit 99.1, shall not be deemed “filed” for purposes of Section 18 of the Securities Exchange Act of 1934, as amended (the “Exchange Act”), or otherwise subject to the liabilities under that Section and shall not be deemed to be incorporated by reference into any filing of the Company under the Exchange Act or the Securities Act of 1933, as amended (the “Securities Act”), except to the extend that the registrant specifically incorporates any such information by reference.
| Item 7.01. | Regulation FD Disclosure. |
On May 1, 2014, the Company released a slide presentation expected to be used by the Company in connection with certain future investor presentations, together with a corresponding script. Copies of the slide presentation and script are attached as Exhibit 99.2 and Exhibit 99.3, respectively, to this Current Report on Form 8-K.
The slide presentation and script should be read together and with the Company’s filings with the Securities and Exchange Commission (the “SEC”), including the Quarterly Report on Form 10-Q for the quarter ended March 31, 2014.
The information furnished in this Item 7.01, including Exhibit 99.2 and Exhibit 99.3, shall not be deemed “filed” for purposes of Section 18 of the Exchange Act or otherwise subject to the liabilities of that Section, and shall not be deemed to be incorporated by reference into any filing of the Company under the Exchange Act or the Securities Act, except to the extent that the registrant specifically incorporates any such information by reference.
| Item 9.01. | Financial Statements and Exhibits. |
(d) Exhibits
| Exhibit |
Exhibit Description | |
| 99.1 | Press Release, dated May 1, 2014, issued by XPO Logistics, Inc. | |
| 99.2 | Investor Presentation, dated May 1, 2014 | |
| 99.3 | Investor Presentation Script, dated May 1, 2014 | |
SIGNATURE
Pursuant to the requirements of the Securities Exchange Act of 1934, the registrant has duly caused this report to be signed on its behalf by the undersigned hereunto duly authorized.
| Date: May 1, 2014 | XPO LOGISTICS, INC. | |||||
| By: | /s/ Gordon E. Devens | |||||
| Gordon E. Devens | ||||||
| Senior Vice President and General Counsel | ||||||
EXHIBIT INDEX
| Exhibit |
Exhibit Description | |
| 99.1 | Press Release, dated May 1, 2014, issued by XPO Logistics, Inc. | |
| 99.2 | Investor Presentation, dated May 1, 2014 | |
| 99.3 | Investor Presentation Script, dated May 1, 2014 | |
Exhibit 99.1

XPO Logistics Announces First Quarter 2014 Results
Reports 51% organic growth company-wide
Raises estimate for cost synergies from Pacer integration to $15 million
Opens freight brokerage cold-start in Kansas City
Reaffirms full year 2014 guidance
GREENWICH, Conn. — May 1, 2014 — XPO Logistics, Inc. (NYSE: XPO) today announced financial results for the first quarter of 2014. Total gross revenue increased 147.7% year-over-year to $282.4 million. Net revenue increased 259.1% to $58.4 million.1
The company reported a net loss of $28.1 million for the quarter, compared with a net loss of $14.5 million for the same period in 2013. The net loss available to common shareholders was $28.9 million, or a loss of $0.70 per diluted share, compared with a net loss of $15.3 million, or a loss of $0.85 per diluted share, for the same period in 2013. The company’s first quarter 2014 results reflect: $10.8 million, or $7.5 million after-tax, of transaction and integration costs related to the acquisition of Pacer International, Inc.; $4.5 million, or $3.7 million after-tax, for a commitment fee related to an undrawn debt funding option for the Pacer transaction; and $2.3 million, before-tax and after-tax, related to conversions of the company’s convertible senior notes.
Earnings (loss) before interest, taxes, depreciation and amortization (“EBITDA”), a non-GAAP financial measure, was a loss of $10.1 million for the quarter, compared with a loss of $9.8 million for the same period in 2013. EBITDA for the first quarter reflects $1.4 million and $1.1 million of non-cash share-based compensation for 2014 and 2013, respectively. Excluding $10.8 million of transaction and integration costs related to the Pacer acquisition, adjusted EBITDA for the first quarter of 2014 was $678,000. Reconciliations of EBITDA and adjusted EBITDA to net income are provided in the attached financial tables.
The company had approximately $157 million of cash, including $13 million of restricted cash, as of March 31, 2014, immediately following its acquisition of Pacer.
Reaffirms Full Year Financial Targets
The company reaffirmed its full year 2014 targets for an annual revenue run rate of at least $2.75 billion and an annual EBITDA run rate of at least $100 million by December 31. The company expects to acquire at least $400 million of historical annual revenue in 2014, excluding the Pacer acquisition.
| 1 | Effective 2014, the company began reporting Net Revenue and Net Revenue Margin instead of the equivalent Gross Margin and Gross Margin Percentage to conform the presentation of operating expenses with its acquired intermodal operations. Refer to the attached financial tables for further information. |
CEO Comments
Bradley Jacobs, chairman and chief executive officer of XPO Logistics, said, “In the first quarter, we increased our revenue to $282 million – significantly more than expected – including notable year-over-year organic growth of 51%. Our 11 brokerage cold-starts, including our newest branch in Kansas City, are on a combined revenue run rate of $190 million, nearly triple the rate of 12 months ago. Our employee productivity metrics are on the rise, and our strategic accounts team signed 33 new major accounts in the quarter.
“Our expedited business, which benefited from weather-related supply chain disruptions, increased first quarter profitability fivefold from a year ago. This included the impact of our online portal XPO NLM, which we purchased in December: XPO NLM managed over 130,000 expedited loads in the first quarter, a 47% increase in volume from a year ago. We increased freight forwarding revenue by more than 20% year-over-year, and improved our brokerage margin by 90 basis points, excluding the benefit of last-mile margin. We capped the quarter with our purchase of Pacer International on March 31.
“The integration of Pacer is going extremely well. We’ve already unified our sales force, and we have many large intermodal bids in the pipeline. We moved the former Pacer truck brokerage operation onto our proprietary Freight Optimizer technology, giving them access to our network of over 26,000 carriers. And we’ve made great progress at right-sizing costs in technology, real estate, sales and administrative functions. We acted quickly to reverse the losses in Pacer’s logistics business by closing 10 underperforming locations and consolidating six duplicative offices in the U.S., Asia and Europe. The remaining locations have become part of our XPO Global Logistics freight forwarding network. We now expect to capture about $15 million of cost synergies – three times our original estimate – while expanding services to our customers.”
Jacobs continued, “Excluding the costs associated with the acquisition of Pacer, this was our second straight quarter of positive EBITDA. We’re on track to meet our target run rate of $100 million of EBITDA by year-end 2014, and approximately $425 million of EBITDA in 2017 on revenue of $7.5 billion.”
First Quarter 2014 Results by Business Unit
| • | Freight brokerage: The company’s freight brokerage business generated total gross revenue of $231.7 million for the quarter, a 196.2% increase from the same period in 2013. Net revenue margin1 was 19.1%, compared with 12.9% in 2013, an improvement of 620 basis points. The year-over-year increases in revenue and margin for the quarter were primarily due to the acquisition of high-margin last-mile logistics providers 3PD and Optima Service Solutions in 2013, 75% organic revenue growth, and continued margin improvement. Excluding the benefit of last-mile margin, freight brokerage net revenue margin improved 90 basis points, compared with 2013. The increase in net revenue was offset by higher intangible asset amortization related to acquisitions, and by the company’s strategic investments in sales and procurement personnel over the trailing 12 months. First quarter operating income was a loss of $4.0 million, compared with a loss of $3.8 million a year ago. |
| • | Expedited transportation: The company’s expedited transportation business generated total gross revenue of $33.8 million for the quarter, a 41.6% increase from the same period in 2013. Net revenue margin was 33.6%, compared with 15.9% in 2013, an improvement of 1,770 basis points. The year-over-year increase in net revenue margin primarily reflects |
| the acquisition of managed transportation expeditor NLM, which generated $6.4 million of gross revenue and net revenue in the first quarter. Excluding NLM, expedited net revenue margin improved, driven largely by higher revenue per mile. First quarter operating income was $3.7 million, compared with $753,000 a year ago, primarily reflecting the positive impact of NLM and significant organic margin improvement. |
| • | Freight forwarding: The company’s freight forwarding business generated total gross revenue of $19.5 million for the quarter, a 20.2% increase from the same period in 2013. Net revenue margin was 13.9%, compared with 14.7% in 2013. The decrease in net revenue margin was primarily due to an increase in international shipments, which typically generate higher revenue, but at a lower margin, than domestic shipments. First quarter operating income was $552,000, a 48.4% increase year-over-year. |
| • | Corporate: Corporate SG&A expense for the first quarter of 2014 was $21.7 million, compared with $8.7 million for the first quarter of 2013. Corporate SG&A includes: $6.4 million, or $5.3 million after-tax, of integration charges related to the acquisition of Pacer; $4.6 million, or $4.1 million after-tax, of acquisition-related transaction costs primarily related to Pacer; and $1.2 million, or $1.0 million after-tax, of litigation costs. |
Raises Estimate for Cost Synergies from Pacer Integration to $15 Million
The company increased its target for cost synergies related to the integration of Pacer International, Inc., acquired March 31, 2014. The company now expects to realize approximately $15 million of synergies.
Opens Freight Brokerage Cold-start in Kansas City
On March 31, 2014, the company opened a cold-start location in Kansas City, Mo., as part of a planned organic expansion of its freight brokerage footprint. The branch is the company’s eleventh freight brokerage cold-start.
Conference Call
The company will hold a conference call on Friday, May 2, 2014, at 8:30 a.m. Eastern Time. Participants can call toll-free (from U.S./Canada) 1-800-708-4539; international callers dial +1-847-619-6396. A live webcast of the conference will be available on the investor relations area of the company’s website, www.xpologistics.com/investors. The conference will be archived until June 1, 2014. To access the replay by phone, call toll-free (from U.S./Canada) 1-888-843-7419; international callers dial +1-630-652-3042. Use participant passcode 37094021.
About XPO Logistics, Inc.
XPO Logistics, Inc. (NYSE: XPO) is one of the fastest growing providers of transportation logistics services in North America: the fourth largest freight brokerage firm, the third largest provider of intermodal services, the largest provider of last-mile logistics for heavy goods, and the largest manager of expedited shipments, with growing positions in managed transportation, global freight forwarding and less-than-truckload brokerage. The company facilitates more than 25,000 deliveries a day throughout the U.S., Mexico and Canada.
XPO Logistics has 123 locations and approximately 3,000 employees. Its three business segments – freight brokerage, expedited transportation and freight forwarding – utilize
relationships with ground, rail, sea and air carriers to serve over 14,000 customers in the manufacturing, industrial, retail, commercial, life sciences and government sectors. The company has more than 1,000 owner-operator trucks under contract to its drayage and expedited subsidiaries, and has access to additional capacity through its relationships with over 26,000 other carriers. For more information: www.xpologistics.com
Explanatory Note Regarding Impact of Pacer Acquisition
The company acquired Pacer International, Inc. on March 31, 2014. Accordingly, the company’s financial statements for the first quarter of 2014 do not include any results of operations for Pacer. However, the balance sheet for Pacer is reflected in the company’s consolidated balance sheets as of March 31.
Non-GAAP Financial Measures
This press release contains certain non-GAAP financial measures as defined under Securities and Exchange Commission (“SEC”) rules, such as earnings (loss) before interest, taxes, depreciation and amortization (“EBITDA”) and adjusted EBITDA for the quarters ended March 31, 2014 and 2013. As required by SEC rules, we provide reconciliations of these measures to the most directly comparable measure under United States generally accepted accounting principles (“GAAP”), which are set forth in the attachments to this release. We believe that EBITDA and adjusted EBITDA improve comparability from period to period by removing the impact of our capital structure (interest expense from our outstanding debt), asset base (depreciation and amortization) and tax consequences, and, in the case of adjusted EBITDA, non-recurring costs related to the Pacer acquisition. In addition to its use by management, we believe that EBITDA and adjusted EBITDA are measures widely used by securities analysts, investors and others to evaluate the financial performance of companies in our industry. Other companies may calculate EBITDA and adjusted EBITDA differently, and therefore our measures may not be comparable to similarly titled measures of other companies. EBITDA and adjusted EBITDA are not measures of financial performance or liquidity under GAAP and should not be considered in isolation or as an alternative to net income, cash flows from operating activities and other measures determined in accordance with GAAP. Items excluded from EBITDA and adjusted EBITDA are significant and necessary components of the operations of our business, and, therefore, EBITDA and adjusted EBITDA should only be used as supplemental measures of our operating performance.
Forward-looking Statements
This press release includes forward-looking statements within the meaning of Section 27A of the Securities Act of 1933, as amended, and Section 21E of the Securities Exchange Act of 1934, as amended, including the company’s full year 2014 and full year 2017 financial targets and expected cost synergies from the Pacer integration. All statements other than statements of historical fact are, or may be deemed to be, forward-looking statements. In some cases, forward-looking statements can be identified by the use of forward-looking terms such as “anticipate,” “estimate,” “believe,” “continue,” “could,” “intend,” “may,” “plan,” “potential,” “predict,” “should,” “will,” “expect,” “objective,” “projection,” “forecast,” “goal,” “guidance,” “outlook,” “effort,” “target” or the negative of these terms or other comparable terms. However, the absence of these words does not mean that the statements are not forward-looking. These forward-looking statements are based on certain assumptions and analyses made by us in light of our experience and our perception of historical trends, current conditions and expected future developments, as well as other factors we believe are appropriate in the circumstances.
These forward-looking statements are subject to known and unknown risks, uncertainties and assumptions that may cause actual results, levels of activity, performance or achievements to be materially different from any future results, levels of activity, performance or achievements expressed or implied by such forward-looking statements. Factors that might cause or contribute to a material difference include, but are not limited to, those discussed in XPO’s filings with the SEC and the following: economic conditions generally; competition; XPO’s ability to find suitable acquisition candidates and execute its acquisition strategy; the expected impact of acquisitions, including the expected impact on XPO’s results of operations; XPO’s ability to raise debt and equity capital; XPO’s ability to attract and retain key employees to execute its growth strategy; litigation, including litigation related to alleged misclassification of independent contractors; the ability to develop and implement a suitable information technology system; the ability to maintain positive relationships with XPO’s networks of third-party transportation providers; the ability to retain XPO’s and acquired businesses’ largest customers; XPO’s ability to successfully integrate acquired businesses and realize anticipated synergies and cost savings; rail and other network changes; weather and other service disruptions; and governmental regulation. All forward-looking statements set forth in this press release are qualified by these cautionary statements and there can be no assurance that the actual results or developments anticipated will be realized or, even if substantially realized, that they will have the expected consequences to, or effects on, XPO or its businesses or operations. Forward-looking statements set forth in this document speak only as of the date hereof, and XPO undertakes no obligation to update forward-looking statements to reflect subsequent events or circumstances, changes in expectations or the occurrence of unanticipated events except to the extent required by law.
Investor Contact:
XPO Logistics, Inc.
Tavio Headley, +1-203-930-1602
tavio.headley@xpologistics.com
Media Contacts:
Brunswick Group
Gemma Hart, Darren McDermott, +1-212-333-3810
XPO Logistics, Inc.
Condensed Consolidated Statements of Operations
(Unaudited)
(In thousands, except per share data)
| Three Months Ended March 31, |
||||||||
| 2014 | 2013 | |||||||
| Revenue |
$ | 282,403 | $ | 113,999 | ||||
| Operating expenses |
||||||||
| Cost of purchased transportation and services |
224,006 | 97,739 | ||||||
| Direct operating expense |
3,880 | — | ||||||
| Sales, general and administrative expense |
75,878 | 27,627 | ||||||
|
|
|
|
|
|||||
| Total operating expenses |
303,764 | 125,366 | ||||||
|
|
|
|
|
|||||
| Operating loss |
(21,361 | ) | (11,367 | ) | ||||
|
|
|
|
|
|||||
| Other expense (income) |
15 | (109 | ) | |||||
| Interest expense |
10,058 | 3,064 | ||||||
|
|
|
|
|
|||||
| Loss before income tax provision |
(31,434 | ) | (14,322 | ) | ||||
| Income tax (benefit) provision |
(3,299 | ) | 222 | |||||
|
|
|
|
|
|||||
| Net loss |
(28,135 | ) | (14,544 | ) | ||||
| Cumulative preferred dividends |
(742 | ) | (743 | ) | ||||
|
|
|
|
|
|||||
| Net loss available to common shareholders |
$ | (28,877 | ) | $ | (15,287 | ) | ||
|
|
|
|
|
|||||
| Basic loss per share |
||||||||
| Net loss |
$ | (0.70 | ) | $ | (0.85 | ) | ||
| Diluted loss per share |
||||||||
| Net loss |
$ | (0.70 | ) | $ | (0.85 | ) | ||
| Weighted average common shares outstanding |
||||||||
| Basic weighted average common shares outstanding |
41,313 | 18,032 | ||||||
| Diluted weighted average common shares outstanding |
41,313 | 18,032 | ||||||
XPO Logistics, Inc.
Condensed Consolidated Balance Sheets
(In thousands, except share data)
| March 31, 2014 |
December 31, 2013 |
|||||||
| (Unaudited) | ||||||||
| ASSETS | ||||||||
| Current assets: |
||||||||
| Cash and cash equivalents |
$ | 143,886 | $ | 21,524 | ||||
| Accounts receivable, net of allowances of $5,066 and $3,539, respectively |
342,752 | 134,227 | ||||||
| Prepaid expenses |
8,515 | 3,935 | ||||||
| Deferred tax asset, current |
6,182 | 3,041 | ||||||
| Other current assets |
10,869 | 7,304 | ||||||
|
|
|
|
|
|||||
| Total current assets |
512,204 | 170,031 | ||||||
|
|
|
|
|
|||||
| Property and equipment, net of $15,658 and $11,803 in accumulated depreciation, respectively |
98,819 | 56,571 | ||||||
| Goodwill |
539,168 | 363,448 | ||||||
| Identifiable intangible assets, net of $22,722 and $15,411 in accumulated amortization, respectively |
250,203 | 185,179 | ||||||
| Deferred tax asset, long-term |
511 | 72 | ||||||
| Restricted cash |
13,332 | 2,141 | ||||||
| Other long-term assets |
9,518 | 2,799 | ||||||
|
|
|
|
|
|||||
| Total long-term assets |
911,551 | 610,210 | ||||||
|
|
|
|
|
|||||
| Total assets |
$ | 1,423,755 | $ | 780,241 | ||||
|
|
|
|
|
|||||
| LIABILITIES AND STOCKHOLDERS’ EQUITY | ||||||||
| Current liabilities: |
||||||||
| Accounts payable |
$ | 227,738 | $ | 71,391 | ||||
| Accrued salaries and wages |
19,257 | 11,741 | ||||||
| Accrued expenses, other |
45,947 | 9,489 | ||||||
| Current maturities of long-term debt |
1,777 | 2,028 | ||||||
| Other current liabilities |
6,486 | 4,684 | ||||||
|
|
|
|
|
|||||
| Total current liabilities |
301,205 | 99,333 | ||||||
|
|
|
|
|
|||||
| Convertible senior notes |
99,844 | 106,268 | ||||||
| Revolving credit facility and other long-term debt, net of current maturities |
470 | 75,373 | ||||||
| Deferred tax liability, long-term |
24,793 | 15,200 | ||||||
| Other long-term liabilities |
32,663 | 28,224 | ||||||
|
|
|
|
|
|||||
| Total long-term liabilities |
157,770 | 225,065 | ||||||
|
|
|
|
|
|||||
| Commitments and contingencies |
||||||||
| Stockholders’ equity: |
||||||||
| Preferred stock, $.001 par value; 10,000,000 shares; 73,335 and 74,175 shares issued and outstanding, respectively |
42,258 | 42,737 | ||||||
| Common stock, $.001 par value; 150,000,000 shares authorized; 52,570,800 and 30,583,073 shares issued, respectively; and 52,525,800 and 30,538,073 shares outstanding, respectively |
53 | 30 | ||||||
| Additional paid-in capital |
1,063,242 | 524,972 | ||||||
| Treasury stock, at cost, 45,000 shares held |
(107 | ) | (107 | ) | ||||
| Accumulated deficit |
(140,666 | ) | (111,789 | ) | ||||
|
|
|
|
|
|||||
| Total stockholders’ equity |
964,780 | 455,843 | ||||||
|
|
|
|
|
|||||
| Total liabilities and stockholders’ equity |
$ | 1,423,755 | $ | 780,241 | ||||
|
|
|
|
|
|||||
XPO Logistics, Inc.
Condensed Consolidated Statements of Cash Flows
(Unaudited)
(In thousands)
| Three Months Ended March 31, |
||||||||
| 2014 | 2013 | |||||||
| Operating activities |
||||||||
| Net loss |
$ | (28,135 | ) | $ | (14,544 | ) | ||
| Adjustments to reconcile net loss to net cash from operating activities |
||||||||
| Provisions for allowance for doubtful accounts |
2,196 | 231 | ||||||
| Depreciation and amortization |
11,273 | 1,554 | ||||||
| Stock compensation expense |
2,206 | 1,097 | ||||||
| Accretion of debt |
1,430 | 1,438 | ||||||
| Other |
2,062 | (211 | ) | |||||
| Changes in assets and liabilities, net of effects of acquisitions: |
||||||||
| Accounts receivable |
(56,414 | ) | (9,771 | ) | ||||
| Deferred tax expense |
(4,529 | ) | 135 | |||||
| Income tax payable |
2,298 | (814 | ) | |||||
| Prepaid expense and other current assets |
114 | (62 | ) | |||||
| Other long-term assets |
(96 | ) | (2 | ) | ||||
| Accounts payable |
48,676 | (3,417 | ) | |||||
| Accrued expenses and other liabilities |
10,177 | (3,659 | ) | |||||
|
|
|
|
|
|||||
| Cash flows used by operating activities |
(8,742 | ) | (28,025 | ) | ||||
|
|
|
|
|
|||||
| Investing activities |
||||||||
| Acquisition of businesses, net of cash acquired |
(190,962 | ) | (16,560 | ) | ||||
| Payment for purchases of property and equipment |
(3,935 | ) | (1,081 | ) | ||||
| Other |
246 | 125 | ||||||
|
|
|
|
|
|||||
| Cash flows used by investing activities |
(194,651 | ) | (17,516 | ) | ||||
|
|
|
|
|
|||||
| Financing activities |
||||||||
| Repayment of borrowings on revolving debt facility |
(75,000 | ) | — | |||||
| Proceeds from stock offering, net |
413,183 | — | ||||||
| Payment for cash held as collateral in lending arrangement |
(11,269 | ) | — | |||||
| Dividends paid to preferred stockholders |
(742 | ) | (743 | ) | ||||
| Other |
(417 | ) | 173 | |||||
|
|
|
|
|
|||||
| Cash flows provided (used) by financing activities |
325,755 | (570 | ) | |||||
|
|
|
|
|
|||||
| Net increase (decrease) in cash |
122,362 | (46,111 | ) | |||||
| Cash and cash equivalents, beginning of period |
21,524 | 252,293 | ||||||
|
|
|
|
|
|||||
| Cash and cash equivalents, end of period |
$ | 143,886 | $ | 206,182 | ||||
|
|
|
|
|
|||||
| Supplemental disclosure of cash flow information: |
||||||||
| Cash paid for interest |
$ | 4,287 | $ | 3,328 | ||||
| Cash (received) paid for income taxes |
$ | (1,507 | ) | $ | 732 | |||
| Equity portion of acquisition purchase price |
$ | 108,815 | $ | 2,573 | ||||
Freight Brokerage
Summary Financial Table
(Unaudited)
(In thousands)
| Three Months Ended March 31, | ||||||||||||||||
| 2014 | 2013 | $ Variance | Change % | |||||||||||||
| Revenue |
$ | 231,689 | $ | 78,230 | $ | 153,459 | 196.2 | % | ||||||||
| Cost of purchased transportation and services |
187,372 | 68,164 | 119,208 | 174.9 | % | |||||||||||
|
|
|
|
|
|
|
|
|
|||||||||
| Net revenue |
44,317 | 10,066 | 34,251 | 340.3 | % | |||||||||||
|
|
|
|
|
|
|
|
|
|||||||||
| Direct operating expense |
3,880 | — | 3,880 | 100.0 | % | |||||||||||
| SG&A expense |
||||||||||||||||
| Salaries & benefits |
25,526 | 10,163 | 15,363 | 151.2 | % | |||||||||||
| Other SG&A expense |
7,841 | 1,895 | 5,946 | 313.8 | % | |||||||||||
| Purchased services |
2,072 | 814 | 1,258 | 154.5 | % | |||||||||||
| Depreciation & amortization |
8,993 | 1,014 | 7,979 | 786.9 | % | |||||||||||
|
|
|
|
|
|
|
|
|
|||||||||
| Total SG&A expense |
44,432 | 13,886 | 30,546 | 220.0 | % | |||||||||||
|
|
|
|
|
|
|
|
|
|||||||||
| Operating loss |
$ | (3,995 | ) | $ | (3,820 | ) | $ | (175 | ) | 4.6 | % | |||||
|
|
|
|
|
|
|
|
|
|||||||||
Freight Brokerage
Key Data
(In thousands, except personnel data)
| 3 Mos Ended March 31, 2014 |
3 Mos Ended March 31, 2013 |
|||||||
| Revenue |
||||||||
| Truckload, LTL, and Intermodal |
$ | 144,585 | $ | 78,230 | ||||
| Last Mile |
87,104 | — | ||||||
|
|
|
|
|
|||||
| Total Revenue |
$ | 231,689 | $ | 78,230 | ||||
|
|
|
|
|
|||||
| Net Revenue |
||||||||
| Truckload, LTL, and Intermodal |
$ | 19,921 | $ | 10,066 | ||||
| Last Mile |
24,396 | — | ||||||
|
|
|
|
|
|||||
| Total Net Revenue |
$ | 44,317 | $ | 10,066 | ||||
|
|
|
|
|
|||||
| Net Revenue % |
||||||||
| Truckload, LTL, and Intermodal |
13.8 | % | 12.9 | % | ||||
| Last Mile |
28.0 | % | — | |||||
|
|
|
|
|
|||||
| Overall Net Revenue % |
19.1 | % | 12.9 | % | ||||
|
|
|
|
|
|||||
| Freight Brokerage personnel (end of period) |
2,331 | 668 | ||||||
Note: Employee totals are as of period end, and primarily include the positions of shipper sales, carrier procurement and brokerage operations, and reflect the impact of recruitment and acquisitions.
Expedited Transportation
Summary Financial Table
(Unaudited)
(In thousands)
| Three Months Ended March 31, | ||||||||||||||||
| 2014 | 2013 | $ Variance | Change % | |||||||||||||
| Revenue |
$ | 33,810 | $ | 23,875 | $ | 9,935 | 41.6 | % | ||||||||
| Cost of purchased transportation and services |
22,442 | 20,067 | 2,375 | 11.8 | % | |||||||||||
|
|
|
|
|
|
|
|
|
|||||||||
| Net revenue |
11,368 | 3,808 | 7,560 | 198.5 | % | |||||||||||
|
|
|
|
|
|
|
|
|
|||||||||
| SG&A expense |
||||||||||||||||
| Salaries & benefits |
4,154 | 1,945 | 2,209 | 113.6 | % | |||||||||||
| Other SG&A expense |
1,456 | 604 | 852 | 141.1 | % | |||||||||||
| Purchased services |
434 | 289 | 145 | 50.2 | % | |||||||||||
| Depreciation & amortization |
1,578 | 217 | 1,361 | 627.2 | % | |||||||||||
|
|
|
|
|
|
|
|
|
|||||||||
| Total SG&A expense |
7,622 | 3,055 | 4,567 | 149.5 | % | |||||||||||
|
|
|
|
|
|
|
|
|
|||||||||
| Operating income |
$ | 3,746 | $ | 753 | $ | 2,993 | 397.5 | % | ||||||||
|
|
|
|
|
|
|
|
|
|||||||||
Note: Total depreciation and amortization for the Expedited Transportation reportable segment included in both direct expense and SG&A, was $1,612,000 and $268,000 for the three-months ended March 31, 2014 and 2013, respectively.
Freight Forwarding
Summary Financial Table
(Unaudited)
(In thousands)
| Three Months Ended March 31, | ||||||||||||||||
| 2014 | 2013 | $ Variance | Change % | |||||||||||||
| Revenue |
$ | 19,506 | $ | 16,233 | $ | 3,273 | 20.2 | % | ||||||||
| Cost of purchased transportation and services |
16,793 | 13,847 | 2,946 | 21.3 | % | |||||||||||
|
|
|
|
|
|
|
|
|
|||||||||
| Net revenue |
2,713 | 2,386 | 327 | 13.7 | % | |||||||||||
|
|
|
|
|
|
|
|
|
|||||||||
| SG&A expense |
||||||||||||||||
| Salaries & benefits |
1,635 | 1,433 | 202 | 14.1 | % | |||||||||||
| Other SG&A expense |
349 | 403 | (54 | ) | -13.4 | % | ||||||||||
| Purchased services |
77 | 90 | (13 | ) | -14.4 | % | ||||||||||
| Depreciation & amortization |
100 | 88 | 12 | 13.6 | % | |||||||||||
|
|
|
|
|
|
|
|
|
|||||||||
| Total SG&A expense |
2,161 | 2,014 | 147 | 7.3 | % | |||||||||||
|
|
|
|
|
|
|
|
|
|||||||||
| Operating income |
$ | 552 | $ | 372 | $ | 180 | 48.4 | % | ||||||||
|
|
|
|
|
|
|
|
|
|||||||||
XPO Corporate
Summary of Sales, General & Administrative Expense
(Unaudited)
(In thousands)
| Three Months Ended March 31, | ||||||||||||||||
| 2014 | 2013 | $ Variance | Change % | |||||||||||||
| SG&A expense |
||||||||||||||||
| Salaries & benefits |
$ | 9,844 | $ | 4,507 | $ | 5,337 | 118.4 | % | ||||||||
| Other SG&A expense |
3,620 | 1,359 | 2,261 | 166.4 | % | |||||||||||
| Purchased services |
7,632 | 2,622 | 5,010 | 191.1 | % | |||||||||||
| Depreciation & amortization |
568 | 184 | 384 | 208.7 | % | |||||||||||
|
|
|
|
|
|
|
|
|
|||||||||
| Total SG&A expense |
$ | 21,664 | $ | 8,672 | $ | 12,992 | 149.8 | % | ||||||||
|
|
|
|
|
|
|
|
|
|||||||||
Note: Intercompany eliminations included revenue of $2.6 million and $4.3 million for the three-months ended March 31, 2014 and 2013, respectively.
Reconciliation of Non-GAAP Measures
XPO Logistics, Inc.
Consolidated Reconciliation of EBITDA to Net Loss
(In thousands)
| Three Months Ended March 31, |
||||||||||||
| 2014 | 2013 | Change % | ||||||||||
| Net loss available to common shareholders |
$ | (28,877 | ) | $ | (15,287 | ) | 88.9 | % | ||||
| Preferred dividends |
(742 | ) | (743 | ) | -0.1 | % | ||||||
|
|
|
|
|
|
|
|||||||
| Net loss |
(28,135 | ) | (14,544 | ) | 93.4 | % | ||||||
|
|
|
|
|
|
|
|||||||
| Interest expense |
10,058 | 3,064 | 228.3 | % | ||||||||
| Income tax benefit |
(3,299 | ) | 222 | -1586.0 | % | |||||||
| Depreciation and amortization |
11,273 | 1,502 | 650.5 | % | ||||||||
|
|
|
|
|
|
|
|||||||
| EBITDA |
$ | (10,103 | ) | $ | (9,756 | ) | 3.6 | % | ||||
|
|
|
|
|
|
|
|||||||
| Pacer transaction and restructuring costs |
(10,781 | ) | — | 100.0 | % | |||||||
|
|
|
|
|
|
|
|||||||
| Adjusted EBITDA |
$ | 678 | $ | (9,756 | ) | -106.9 | % | |||||
|
|
|
|
|
|
|
|||||||
Note: Please refer to the “Non-GAAP Financial Measures” section of the press release.
XPO Logistics, Inc.
Consolidated Calculation of Diluted Weighted Shares Outstanding
| Three Months Ended | ||||||||
| March 31, 2014 | March 31, 2013 | |||||||
| Basic common stock outstanding |
41,312,894 | 18,031,926 | ||||||
|
|
|
|
|
|||||
| Potentially Dilutive Securities: |
||||||||
| Shares underlying the conversion of preferred stock to common stock |
10,503,286 | 10,610,714 | ||||||
| Shares underlying the conversion of the convertible senior notes |
7,741,643 | 8,749,239 | ||||||
| Shares underlying warrants to purchase common stock |
8,004,967 | 6,342,298 | ||||||
| Shares underlying stock options to purchase common stock |
529,385 | 550,611 | ||||||
| Shares underlying restricted stock units |
565,825 | 414,088 | ||||||
|
|
|
|
|
|||||
| 27,345,106 | 26,666,950 | |||||||
|
|
|
|
|
|||||
|
|
|
|
|
|||||
| Diluted weighted shares outstanding |
68,658,000 | 44,698,876 | ||||||
|
|
|
|
|
|||||
Note: For dilution purposes, GAAP requires diluted shares to be reflected on a weighted average basis, which takes into account the portion of the period in which the diluted shares were outstanding. The table above reflects the weighted average diluted shares for the periods presented. The impact of this dilution was not reflected in the earnings per share calculations on the Condensed Consolidated Statements of Operations because the impact was anti-dilutive. The treasury method was used to determine the shares underlying the warrants to purchase common stock with an average closing market price of common stock of $28.85 per share and $17.15 per share for the three months ended March 31, 2014 and 2013, respectively.
For informational purposes, the following table represents fully diluted shares as of March 31, 2014, calculated on a non-weighted basis without giving effect to the portion of any period in which the diluted shares were outstanding. The dilutive effect of the warrants, options and RSUs in the table was calculated using the closing market price of common stock on March 31, 2014. A non-weighted basis for calculating fully diluted shares is a non-GAAP financial measure as defined under SEC rules.
XPO Logistics, Inc.
| Diluted Shares as of March 31, 2014 |
||||
| Common stock outstanding |
52,525,800 | |||
| Preferred stock |
10,476,430 | |||
| Convertible senior notes |
7,341,643 | |||
| Warrants |
8,053,888 | |||
| Outstanding stock options |
648,459 | |||
| Restricted stock units |
1,577,972 | |||
|
|
|
|||
| Total |
80,624,192 | |||
|
|
|
|||
XPO Logistics, Inc.
Prior Period Results Conformed to 2014 Presentation
Consolidated Statements of Operations
(In thousands)
| AS REPORTED | For the | For the | For the | |||||||||||||||||||||||||
| Year Ended | Three Months Ended | Year Ended | ||||||||||||||||||||||||||
| December 31, 2011 |
December 31, 2012 |
March 31, 2013 |
June 30, 2013 |
September 30, 2013 |
December 31, 2013 |
December 31, 2013 |
||||||||||||||||||||||
| Revenue |
$ | 177,076 | $ | 278,591 | $ | 113,999 | $ | 137,091 | $ | 193,982 | $ | 257,231 | $ | 702,303 | ||||||||||||||
| Direct expense |
||||||||||||||||||||||||||||
| Transportation services |
133,007 | 224,035 | 94,880 | 114,924 | 156,446 | 201,555 | 567,805 | |||||||||||||||||||||
| Station commissions |
11,098 | 9,321 | 1,708 | 1,992 | 1,706 | 1,762 | 7,168 | |||||||||||||||||||||
| Other direct expense |
3,193 | 4,409 | 1,151 | 835 | 995 | 842 | 3,823 | |||||||||||||||||||||
|
|
|
|
|
|
|
|
|
|
|
|
|
|
|
|||||||||||||||
| Total direct expense |
147,298 | 237,765 | 97,739 | 117,751 | 159,147 | 204,159 | 578,796 | |||||||||||||||||||||
|
|
|
|
|
|
|
|
|
|
|
|
|
|
|
|||||||||||||||
| Gross margin |
29,778 | 40,826 | 16,260 | 19,340 | 34,835 | 53,072 | 123,507 | |||||||||||||||||||||
|
|
|
|
|
|
|
|
|
|
|
|
|
|
|
|||||||||||||||
| SG&A expense |
||||||||||||||||||||||||||||
| Salaries & benefits |
16,338 | 39,278 | 18,048 | 20,491 | 27,065 | 35,029 | 100,633 | |||||||||||||||||||||
| Other SG&A expense |
3,937 | 11,616 | 4,262 | 5,198 | 9,521 | 10,377 | 29,358 | |||||||||||||||||||||
| Purchased services |
6,733 | 15,388 | 3,815 | 5,914 | 8,311 | 7,174 | 25,214 | |||||||||||||||||||||
| Depreciation and amortization |
1,046 | 2,508 | 1,502 | 1,752 | 8,357 | 9,016 | 20,627 | |||||||||||||||||||||
|
|
|
|
|
|
|
|
|
|
|
|
|
|
|
|||||||||||||||
| Total SG&A expense |
28,054 | 68,790 | 27,627 | 33,355 | 53,254 | 61,596 | 175,832 | |||||||||||||||||||||
|
|
|
|
|
|
|
|
|
|
|
|
|
|
|
|||||||||||||||
| Operating income (loss) |
$ | 1,724 | $ | (27,964 | ) | $ | (11,367 | ) | $ | (14,015 | ) | $ | (18,419 | ) | $ | (8,524 | ) | $ | (52,325 | ) | ||||||||
|
|
|
|
|
|
|
|
|
|
|
|
|
|
|
|||||||||||||||
| AS CONFORMED | For the | For the | For the | |||||||||||||||||||||||||
| Year Ended | Three Months Ended | Year Ended | ||||||||||||||||||||||||||
| December 31, 2011 |
December 31, 2012 |
March 31, 2013 |
June 30, 2013 |
September 30, 2013 |
December 31, 2013 |
December 31, 2013 |
||||||||||||||||||||||
| Revenue |
$ | 177,076 | $ | 278,591 | $ | 113,999 | $ | 137,091 | $ | 193,982 | $ | 257,231 | $ | 702,303 | ||||||||||||||
| Cost of purchased transportation and services |
147,298 | 237,765 | 97,739 | 117,751 | 159,147 | 204,159 | 578,796 | |||||||||||||||||||||
|
|
|
|
|
|
|
|
|
|
|
|
|
|
|
|||||||||||||||
| Net revenue |
29,778 | 40,826 | 16,260 | 19,340 | 34,835 | 53,072 | 123,507 | |||||||||||||||||||||
|
|
|
|
|
|
|
|
|
|
|
|
|
|
|
|||||||||||||||
| Direct operating expense |
0 | 0 | 0 | 0 | 2,077 | 4,278 | 6,355 | |||||||||||||||||||||
| SG&A expense |
||||||||||||||||||||||||||||
| Salaries & benefits |
16,338 | 39,278 | 18,048 | 20,491 | 26,948 | 34,799 | 100,286 | |||||||||||||||||||||
| Other SG&A expense |
3,937 | 11,616 | 4,262 | 5,198 | 8,067 | 7,762 | 25,289 | |||||||||||||||||||||
| Purchased services |
6,733 | 15,388 | 3,815 | 5,914 | 7,805 | 5,741 | 23,275 | |||||||||||||||||||||
| Depreciation and amortization |
1,046 | 2,508 | 1,502 | 1,752 | 8,357 | 9,016 | 20,627 | |||||||||||||||||||||
|
|
|
|
|
|
|
|
|
|
|
|
|
|
|
|||||||||||||||
| Total SG&A expense |
28,054 | 68,790 | 27,627 | 33,355 | 51,177 | 57,318 | 169,477 | |||||||||||||||||||||
|
|
|
|
|
|
|
|
|
|
|
|
|
|
|
|||||||||||||||
| Operating income (loss) |
$ | 1,724 | $ | (27,964 | ) | $ | (11,367 | ) | $ | (14,015 | ) | $ | (18,419 | ) | $ | (8,524 | ) | $ | (52,325 | ) | ||||||||
|
|
|
|
|
|
|
|
|
|
|
|
|
|
|
|||||||||||||||
XPO Logistics, Inc.
Prior Period Results Conformed to 2014 Presentation
Freight Brokerage
Statement of Operations Data
(in thousands)
| AS REPORTED | For the | For the | For the | |||||||||||||||||||||||||
| Year Ended | Three Months Ended | Year Ended | ||||||||||||||||||||||||||
| December 31, 2011 |
December 31, 2012 |
March 31, 2013 |
June 30, 2013 |
September 30, 2013 |
December 31, 2013 |
December 31, 2013 |
||||||||||||||||||||||
| Revenue |
$ | 29,186 | $ | 125,121 | $ | 78,230 | $ | 95,360 | $ | 152,616 | $ | 215,183 | $ | 541,389 | ||||||||||||||
| Direct expense |
||||||||||||||||||||||||||||
| Transportation services |
24,434 | 108,507 | 67,957 | 82,705 | 124,804 | 169,253 | 444,719 | |||||||||||||||||||||
| Other direct expense |
55 | 489 | 207 | 88 | 162 | 118 | 575 | |||||||||||||||||||||
|
|
|
|
|
|
|
|
|
|
|
|
|
|
|
|||||||||||||||
| Total direct expense |
24,489 | 108,996 | 68,164 | 82,793 | 124,966 | 169,371 | 445,294 | |||||||||||||||||||||
|
|
|
|
|
|
|
|
|
|
|
|
|
|
|
|||||||||||||||
| Gross margin |
4,697 | 16,125 | 10,066 | 12,567 | 27,650 | 45,812 | 96,095 | |||||||||||||||||||||
|
|
|
|
|
|
|
|
|
|
|
|
|
|
|
|||||||||||||||
| SG&A expense |
||||||||||||||||||||||||||||
| Salaries & benefits |
2,484 | 15,171 | 10,163 | 12,367 | 17,559 | 24,784 | 64,873 | |||||||||||||||||||||
| Other SG&A expense |
716 | 3,590 | 1,895 | 3,031 | 6,626 | 8,637 | 20,189 | |||||||||||||||||||||
| Purchased services |
148 | 1,695 | 814 | 979 | 2,269 | 3,501 | 7,563 | |||||||||||||||||||||
| Depreciation and amortization |
44 | 1,223 | 1,014 | 1,180 | 4,611 | 8,087 | 14,892 | |||||||||||||||||||||
|
|
|
|
|
|
|
|
|
|
|
|
|
|
|
|||||||||||||||
| Total SG&A expense |
3,392 | 21,679 | 13,886 | 17,557 | 31,065 | 45,009 | 107,517 | |||||||||||||||||||||
|
|
|
|
|
|
|
|
|
|
|
|
|
|
|
|||||||||||||||
| Operating income (loss) |
$ | 1,305 | $ | (5,554 | ) | $ | (3,820 | ) | $ | (4,990 | ) | $ | (3,415 | ) | $ | 803 | $ | (11,422 | ) | |||||||||
|
|
|
|
|
|
|
|
|
|
|
|
|
|
|
|||||||||||||||
| AS CONFORMED | For the | For the | For the | |||||||||||||||||||||||||
| Year Ended | Three Months Ended | Year Ended | ||||||||||||||||||||||||||
| December 31, 2011 |
December 31, 2012 |
March 31, 2013 |
June 30, 2013 |
September 30, 2013 |
December 31, 2013 |
December 31, 2013 |
||||||||||||||||||||||
| Revenue |
$ | 29,186 | $ | 125,121 | $ | 78,230 | $ | 95,360 | $ | 152,616 | $ | 215,183 | $ | 541,389 | ||||||||||||||
| Cost of purchased transportation and services |
24,489 | 108,996 | 68,164 | 82,793 | 124,966 | 169,371 | 445,294 | |||||||||||||||||||||
|
|
|
|
|
|
|
|
|
|
|
|
|
|
|
|||||||||||||||
| Net revenue |
4,697 | 16,125 | 10,066 | 12,567 | 27,650 | 45,812 | 96,095 | |||||||||||||||||||||
|
|
|
|
|
|
|
|
|
|
|
|
|
|
|
|||||||||||||||
| Direct operating expense |
0 | 0 | 0 | 0 | 2,077 | 4,278 | 6,355 | |||||||||||||||||||||
| SG&A expense |
||||||||||||||||||||||||||||
| Salaries & benefits |
2,484 | 15,171 | 10,163 | 12,367 | 17,442 | 24,554 | 64,526 | |||||||||||||||||||||
| Other SG&A expense |
716 | 3,590 | 1,895 | 3,031 | 5,172 | 6,022 | 16,120 | |||||||||||||||||||||
| Purchased services |
148 | 1,695 | 814 | 979 | 1,763 | 2,068 | 5,624 | |||||||||||||||||||||
| Depreciation and amortization |
44 | 1,223 | 1,014 | 1,180 | 4,611 | 8,087 | 14,892 | |||||||||||||||||||||
|
|
|
|
|
|
|
|
|
|
|
|
|
|
|
|||||||||||||||
| Total SG&A expense |
3,392 | 21,679 | 13,886 | 17,557 | 28,988 | 40,731 | 101,162 | |||||||||||||||||||||
|
|
|
|
|
|
|
|
|
|
|
|
|
|
|
|||||||||||||||
| Operating income (loss) |
$ | 1,305 | $ | (5,554 | ) | $ | (3,820 | ) | $ | (4,990 | ) | $ | (3,415 | ) | $ | 803 | $ | (11,422 | ) | |||||||||
|
|
|
|
|
|
|
|
|
|
|
|
|
|
|
|||||||||||||||
 Management Presentation
May 1, 2014
Exhibit 99.2 |
 2
Forward-Looking Statements Disclaimer
This document includes forward-looking statements within the meaning of Section 27A of the
Securities Act of 1933, as amended, and Section 21E of the Securities Exchange Act of 1934, as
amended, including the company’s full year 2014 and full year 2017 financial targets and
expected cost synergies from the Pacer integration. All statements other than statements of historical
fact are, or may be deemed to be, forward- looking statements. In some cases,
forward-looking statements can be identified by the use of forward-looking terms such as "anticipate,"
"estimate," "believe," "continue," "could," "intend,"
"may," "plan," "potential," "predict," "should," "will," "expect," "objective," "projection," "forecast,"
"goal," "guidance," "outlook," "effort," "target" or the
negative of these terms or other comparable terms. However, the absence of these words does not
mean that the statements are not forward-looking. These forward-looking statements are based on certain assumptions and analyses
made by us in light of our experience and our perception of historical trends, current conditions and
expected future developments, as well as other factors we believe are appropriate in the
circumstances. These forward-looking statements are subject to known and unknown risks, uncertainties and
assumptions that may cause actual results, levels of activity, performance or achievements to
be materially different from any future results, levels of activity, performance or achievements
expressed or implied by such forward-looking statements. Factors that might cause or contribute to
a material difference include, but are not limited to, those discussed in XPO’s filings
with the SEC and the following: economic conditions generally; competition; XPO’s ability to find
suitable acquisition candidates and execute its acquisition strategy; the expected impact of
acquisitions, including the expected impact on XPO’s results of operations; XPO’s
ability to raise debt and equity capital; XPO’s ability to attract and retain key employees to execute its growth
strategy; litigation, including litigation related to alleged misclassification of independent
contractors; the ability to develop and implement a suitable information technology
system; the ability to maintain positive relationships with XPO’s networks of third-party transportation providers;
the ability to retain XPO’s and acquired businesses’ largest customers; XPO’s ability
to successfully integrate acquired businesses and realize anticipated synergies and cost
savings; rail and other network changes; weather and other service disruptions; and governmental regulation. All
forward-looking statements set forth in this document are qualified by these cautionary statements
and there can be no assurance that the actual results or developments anticipated will be
realized or, even if substantially realized, that they will have the expected consequences to, or effects
on, XPO or its businesses or operations. Forward-looking statements set forth in this document
speak only as of the date hereof, and XPO undertakes no obligation to update
forward-looking statements to reflect subsequent events or circumstances, changes in expectations or the
occurrence of unanticipated events except to the extent required by law.
|
 3
One of the Largest 3PLs in North America
We facilitate over 25,000 deliveries per day
Sources for rankings: Transport Topics, Journal of Commerce and company data
#4 freight brokerage firm and Top 50 logistics company
#3 provider of intermodal services
#1 provider of cross-border Mexico intermodal
#1 manager of expedited shipments
#1 provider of last-mile logistics for heavy goods
International and domestic freight forwarder
Growing presence in managed transportation and LTL |
 4
Clearly Defined Strategy for Value Creation
Acquire companies that bring value and are highly scalable
Significantly scale up and optimize existing operations
Open cold-starts where sales recruitment can drive revenue
We continue to be on track or ahead of plan
with all three legs of our growth strategy |
 5
Completed 11 strategic acquisitions and established
24 cold-starts in two years
Created leading-edge recruiting and training programs
Introduced scalable IT platform
Added national operations centers for shared services, carrier
procurement and last-mile operations
Stratified customers, assigned a single point of contact to each
Created a culture of passionate on-time performance
Disciplined focus on operational excellence
Precise Execution of Growth Plan |
 6
Massive Commitment to Shipper Satisfaction
Integrated network across North America with global reach
–
Primarily in the manufacturing, industrial, retail, food and
beverage, commercial, life sciences and government sectors
123 locations in the U.S., Canada, Mexico, Asia and Europe
Approximately 3,000 employees
Over 14,000 customers
More than 1,000 owner-operator trucks under contract for
drayage and expedited subsidiaries
Relationships with an additional 26,000 vetted carriers
|
 7
Significant Growth Embedded in XPO’s Model
Strategic
accounts:
market
to
large
shippers
Cold-starts:
expand
footprint
in
markets
with
best
access
to sales talent
Scale
and
productivity:
recruit
sales
reps
and
provide
state-
of-the-art training and IT
Supply
chain
offering:
build
leadership
positions
in
the
fastest-growing areas of logistics
Performance:
become
the
logistics
partner
of
choice
due
to
our relentless focus on on-time pickup and delivery
M&A
program:
focus
on
the
top
100
pipeline
prospects |
 8
Leading Positions in High-Growth Sectors
Sources: Armstrong & Associates, Norbridge, Inc., EVE Partners LLC, FTR
Associates, SJ Consulting Group, Inc., Bureau of Economic Analysis, US
Department of Commerce Sector
Market
Size
($ billions)
Projected
Growth
(x GDP)
Growth Drivers
Truck brokerage
$50
2-3 times
Outsourcing and technology
Intermodal
$15
3-5 times
Long-haul rail efficiencies and
near-sourcing of
manufacturing in Mexico
Heavy goods,
last-mile
$13
5-6 times
Outsourcing and e-commerce |
 9
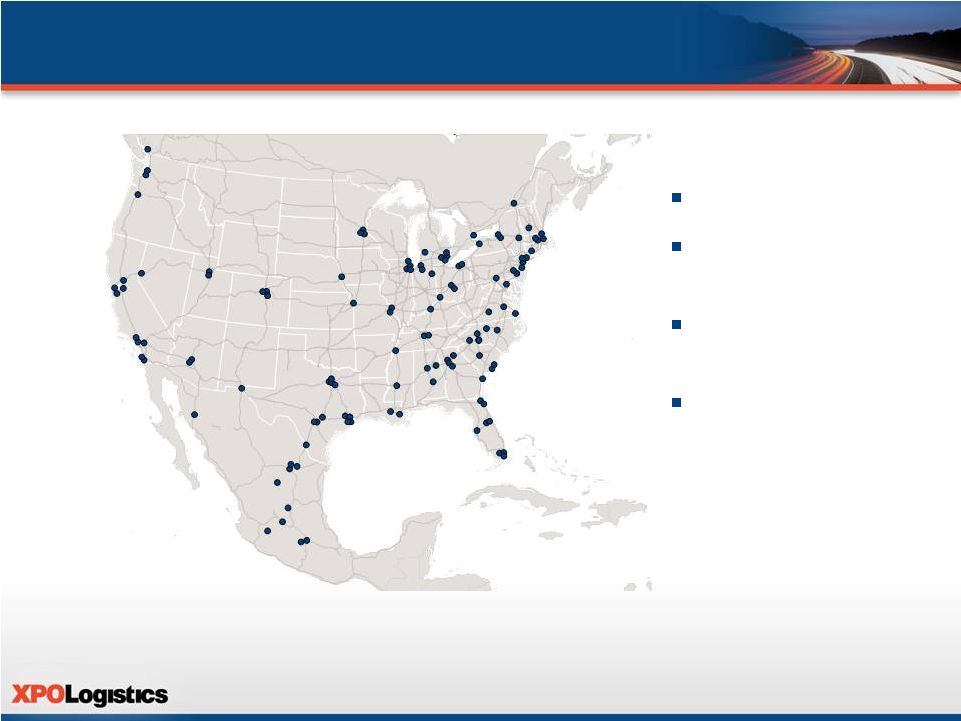
Comprehensive North American Network
Source: Company data
123 locations
Approximately 3,000
employees
Over 26,000 active,
vetted carriers
Access to 60,000 miles
of network rail routes |
 10
Acquired Pacer in March 2014
Provides instant scale in the $15 billion intermodal sector,
the fastest-growing freight mode in North America
–
Third largest provider of intermodal services
–
Largest provider of cross-border Mexico intermodal
Enhances XPO’s value proposition as a large, single-source
supply chain partner with deep capacity
Creates company-wide cross-selling opportunities in every
area of XPO service
Access to 60,000 miles of network rail routes
Sources: SJ Consulting Group, Inc., American Trucking
Associations and company data |
 11
Largest provider of heavy goods, last-mile logistics in
North America
High value, high margin business, growing rapidly due to
e-commerce and outsourcing
Strengthens XPO’s position with shippers as a large,
single-source provider
Industry-leading customer experience IT can be used by XPO
Acquired Optima Service Solutions in November 2013
–
Highly scalable supplier to 3PD, leader in last-mile delivery
of large appliances and electronics
Acquired 3PD in August 2013 |
 12
XPO NLM is the largest manager of expedited shipments
in North America
Acquired NLM in December 2013
#1 provider of web-based transportation management
for expedited
Managing over $1 billion of annual gross transportation spend
–
Online auction system proprietary to XPO
–
Carriers bid on loads that are awarded electronically
Benefits from trend toward just-in-time inventories, and supply
chain disruptions |
 13
Focused Sales and Marketing Effort
Differentiate XPO by providing a passionate commitment to
customer satisfaction across a range of services
Single point of contact for each customer
–
Strategic accounts team marketing to largest 2,000 shippers
–
National accounts team focused on next largest
5,000 companies
–
Branch network expands our reach to hundreds of
thousands of small and medium-sized shippers
Capture more of the $32 billion less-than-truckload opportunity
Sources: SJ Consulting Group, Inc., company data |
 14
One common IT platform for freight brokerage in all cold-starts
and acquired companies
Proprietary freight optimizer tools for pricing and load-covering
put in place in 2012
Highly scalable load execution and tendering via automated
load-to-carrier matching
Total IT budget of more than $70 million for 2014
(1)
Increasing Productivity through Technology
(1) Includes IT budget for Pacer |
 15
24 cold-starts
–
11 in freight brokerage, including Kansas City opened
in March; 12 in freight forwarding; one in expedited
Brokerage cold-starts on an annual revenue run rate of more
than $190 million
–
Nearly triple the run rate 12 months ago
Low capital investment can deliver outsized returns
Hire strong industry veterans as branch presidents
Position in prime recruitment areas and scale up
Growth through Cold-starts |
 16
Founded and led four highly successful companies,
including world-class public corporations
Amerex
Oil
Associates:
Built
one
of
world’s
largest
oil
brokerage
firms
Hamilton
Resources:
Grew
global
oil
trading
company
to
~$1
billion
United
Waste:
Created
5th
largest
solid
waste
business
in
North
America
United
Rentals:
Built
world’s
largest
equipment
rental
company
United Waste stock outperformed S&P 500 by 5.6x from 1992 to 1997
United Rentals stock outperformed S&P 500 by 2.2x from 1997 to 2007
CEO Bradley S. Jacobs |
 17
Highly Skilled Management Team
Partial list
The full management team can be found on www.xpologistics.com
Sean Fernandez
Chief Operating Officer
Tom Connolly
Senior Vice President, Acquisitions
Karl Meyer
Chief Executive Officer, 3PD division
Julie Luna
Chief Commercial Officer
John Hardig
Chief Financial Officer
Lou Amo
Vice President, Carrier Procurement
Dave Rowe
Chief Technology Officer
Mario Harik
Chief Information Officer
Gordon Devens
General Counsel
Scott Malat
Chief Strategy Officer
Troy Cooper
Senior Vice President, Operations and Finance
NCR, Avery Dennison, Arrow Electronics
EVE Partners
Pacer International, Union Pacific
Stifel Nicolaus, Alex. Brown
Electrolux, Union Pacific, Odyssey Logistics
Echo Global Logistics
Oakleaf Waste Management
United Rentals, United Waste
Goldman Sachs, UBS, JPMorgan Chase
AutoNation, Skadden Arps
3PD, Inc., Home Depot |
 18
Deep Bench of Industry Experience Partial list
Jake Schnell
Sr. Operational Process and Integration Manager
Jenna Sargent
Regional Sales and Operation Manager
Marie Fields
Director of Training
Evan Laskaris
Director of Operations, Chicago
Chris Healy
President, Expedited Transportation
Jim Commiskey
Strategic Accounts Manager
Gregory Ritter
Senior Vice President, Strategic Accounts
Doug George
Branch President, Dallas
Will O’Shea
Chief Sales and Marketing Officer, 3PD division
Andrew Armstrong
Sales and Operations Manager
Drew Wilkerson
Branch President, Charlotte
Boyd Brothers, Caliber Logistics, Roberts Express
C.H. Robinson
OHL, Schneider Logistics
C.H. Robinson, American Backhaulers
AFN, CEVA Logistics, Menlo
Pacer International, UPS, Menlo
Knight Brokerage, C.H. Robinson
AFN, Ryder Integrated Logistics
Livingston International, Echo Global Logistics
C.H. Robinson
Ryder Integrated Logistics, Cardinal Logistics |
 19
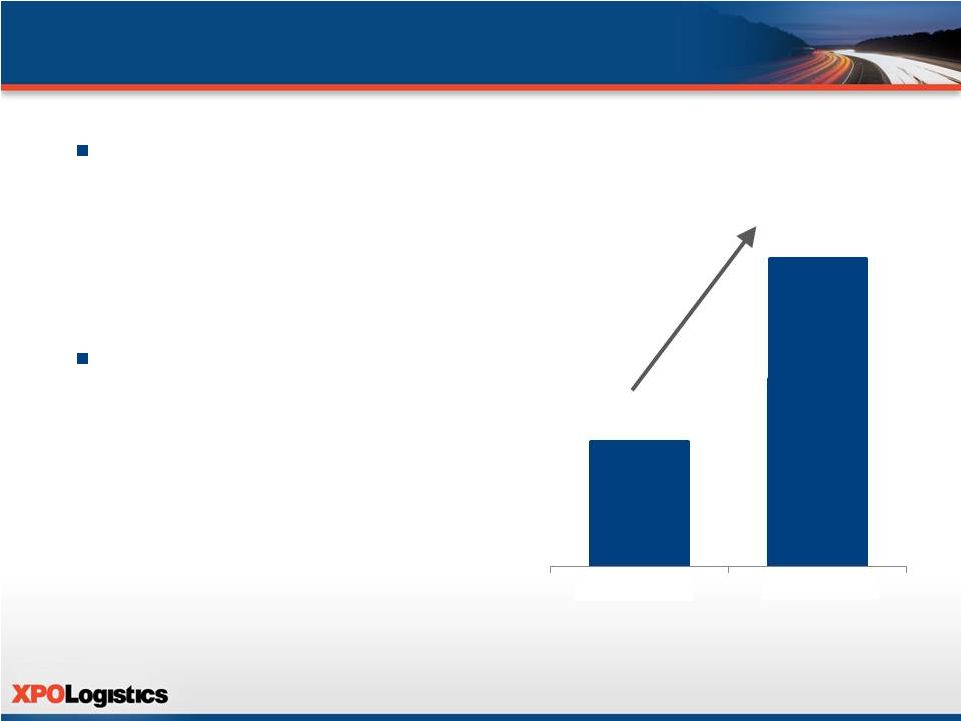
Revenue trajectory
–
2011 revenue of $177 million
–
Currently at approximately $2
billion annual revenue run rate
1Q growth company-wide, 2014
vs. 2013
–
Organic growth up 51%
–
Gross revenue up 148%
–
Net revenue up 259%
Revenue and Margin Growth
Source: Company data
Revenue ($ millions)
+148%
$114
$282
Q1 2013
Q1 2014 |
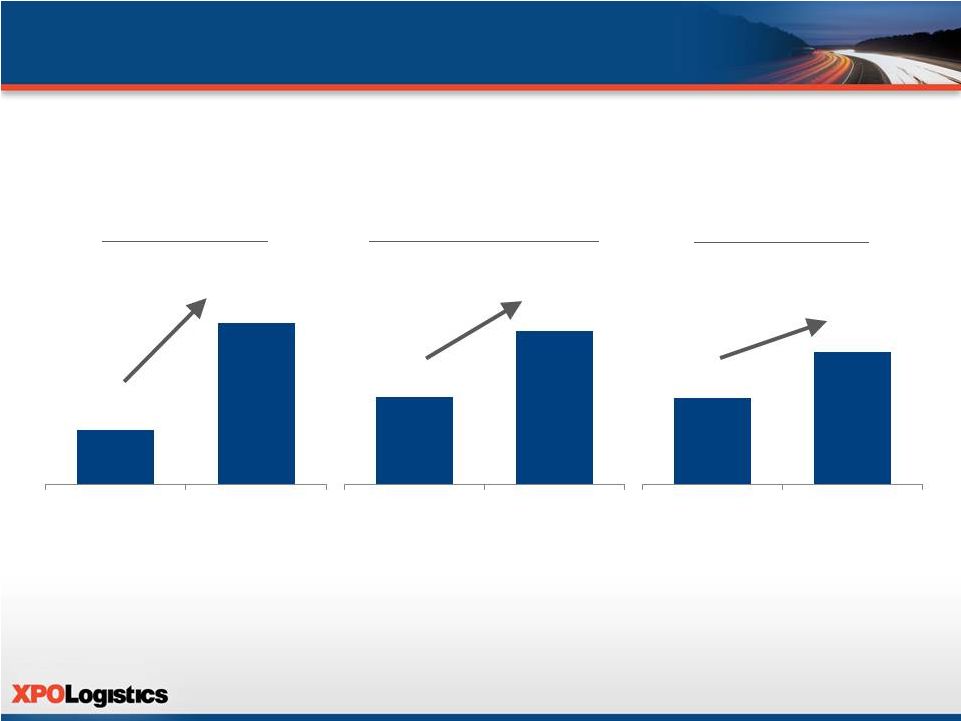 20
Key Financial Statistics
Expedited
Transportation
Freight Brokerage
Freight Forwarding
+196%
+42%
+20%
1Q revenue growth by business unit, 2014 vs. 2013
Organic growth
up 75%
34% margin,
up from 16%
48% increase in
operating income
Revenue ($ millions)
$78
$232
Q1 '13
Q1 '14
$24
$34
Q1 '13
Q1 '14
$16
$20
Q1 '13
Q1 '14 |
 21
First 27 Months of Growth Strategy
Source: Company data
Revenue ($ millions)
2012
2013
2014
$45
$55
$71
$109
$114
$137
$194
$257
$282
Q1
Q2
Q3
Q4
Q1
Q2
Q3
Q4
Q1 |
 22
Full year 2014
Annual revenue run rate of at least $2.75 billion by
December
31
Annual EBITDA run rate of at least $100 million by
December
31
At least $400 million of acquired historical annual revenue,
excluding the Pacer acquisition
Full year 2017
Revenue of $7.5 billion
EBITDA of $425 million
Financial Targets |
 23
Incentivized XPO Management
Equity ownership aligns management team with shareholders
Management
and
directors
own
approx.
29%
of
the
company
(1)
Common Stock Equivalent Capitalization as of 4/30/14
Common Shares
52.5 million
Preferred Shares
10.5 million
Warrants (Strike Price $7 per share)
10.6
million
(7.8
million
dilutive)
(2)
Convertible Senior Notes
7.3
million
shares
(3)
Stock Options and RSUs
2.3
million
shares
dilutive
(4)
Fully Diluted Shares Outstanding
80.4 million shares
Based on SEC beneficial ownership calculation as of April 30, 2014 Dilutive effect
of warrants calculated using treasury method (market close price of $27.14 as of 4/30/14); total warrant proceeds of $74.0 million
Assumes conversion in full of $120.7 million in aggregate principal amount of outstanding 4.50%
convertible senior notes due 2017
As of April 30, 2014, dilutive effect of outstanding RSUs and stock options calculated using treasury
method (market close price of $27.14 as of 4/30/14)
(1)
(2)
(3)
(4) |
 24
Significant growth embedded in XPO’s business model
Leading positions in fastest-growing areas of transportation
Compelling multi-modal value proposition for shippers of
all sizes
Passionate culture of on-time performance and productivity
Top management talent with skills that uniquely fit
growth strategy
Positioned as an irreplaceable, single-source provider
Clear Path for Significant Value Creation |
Exhibit 99.3

May 1, 2014
Presentation Script
The following script should be read in conjunction with the accompanying slide presentation, which contains, among other information, source data for certain information set forth in the script.
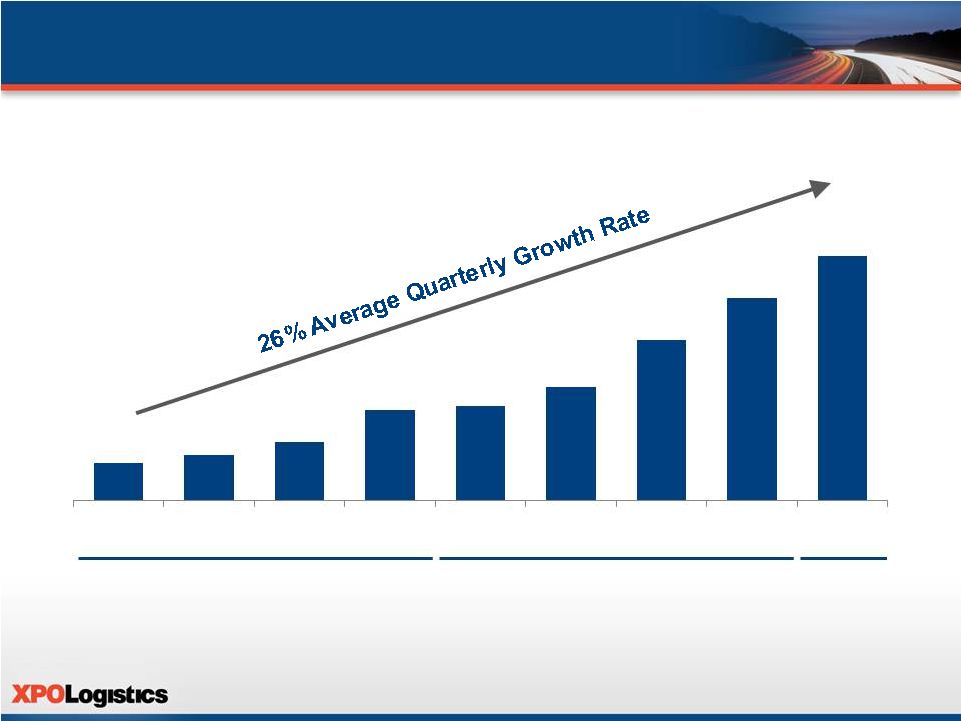
Thank you very much for joining us. To start, for those of you who might not be familiar with XPO, here’s some information about our company and strategy. We’ll explain the drivers behind our 26% average quarterly growth rate over the last 27 months, and our 51% organic growth in the most recent quarter.
We took control of XPO Logistics in September of 2011, with the objective of building a world-class transportation logistics company under the new XPO Logistics brand. We put a highly skilled management team in place and began executing our disciplined strategy for growth:
| • | Acquire attractive companies that bring value and are highly scalable; |
| • | Optimize our existing operations with vigorous recruitment and training programs and state-of-the-art IT; and |
| • | Open cold-starts in locations where we can hire a large number of qualified salespeople to drive returns. |
Today, we’re one of the fastest-growing logistics companies in North America, with a freight brokerage division that we’ve taken from a single location to the fourth largest brokerage firm in two years. We’re the largest provider of last-mile logistics, the largest manager of expedited shipments, and the third largest provider of intermodal services, with growing positions in managed transportation, freight forwarding and less-than-truckload brokerage.
We completed eleven acquisitions to date, including the billion-dollar Pacer business in March. We grew our headcount from barely 200 employees in late 2011 to approximately 3,000 and counting. We developed cutting-edge recruiting, training and onboarding programs. And we introduced a scalable IT platform, with three major upgrades and enhancements every few weeks.
We have a nationwide cold-start program underway with 24 locations operating under experienced leadership: 11 in freight brokerage, 12 in freight forwarding and one in expedite. Our drayage and expedited subsidiaries have more than 1,000 owner-operator trucks under contract. And our capacity procurement hubs in Charlotte, Chicago and Atlanta manage relationships with an additional 26,000 carriers, representing capacity of more than half a million trucks on the road.
Most important, we’ve instilled a high-octane, performance-driven culture focused on delivering world-class service to customers. Our sales and operations people know how to deal with customers on a professional basis, and we work to differentiate XPO by providing a consistently superior customer experience.
Our March acquisition of Pacer International is our fourth in the last eight months. In the last half of 2013, we bought 3PD and Optima – the largest providers in their last-mile sectors. And in December we acquired NLM, the leading online manager of expedited shipments. The addition of NLM to our expedited group made us the largest manager of expedited shipments in North America, and gave us an important foothold in managed transportation. We’ve made XPO a major player in the fastest-growing areas of logistics: last-mile logistics, for example, is growing at five to six times GDP, and intermodal is growing at three to five times GDP.
We’re bullish about the Pacer acquisition for a lot of reasons, but four in particular. First, the intermodal sector is one of the fastest-growing areas of transportation logistics. Second, it made us the third largest provider of intermodal services in North America. Third, we’re now the number one provider of intermodal services in the cross-border Mexico marketplace, which is exhibiting strong growth trends. And fourth, the combination has created growth opportunities in every area of our service offering.
Intermodal is a dynamic, $15 billion sector that has been growing at three to five times GDP. Many shippers are discovering that they can use intermodal to lower their transportation costs for freight that travels at least 600 miles or so, in part because rail can be up to three times more fuel-efficient than truck for long haul. Currently, more than a third of our over-the-road freight movements travel over 600 miles – that could make them ripe for conversion to intermodal.
Cross-border Mexico is a high-growth sector of intermodal, driven by a shift to near-shoring by manufacturers. Mexico offers a competitively priced labor force and greater speed-to-market than overseas locales such as China – and compared to truckload, rail can offer a more cost-effective way to move freight cross-border. In addition, the Mexican government and railroads have made significant investments in the country’s transportation infrastructure. It’s estimated that approximately 2.8 million trucks move cross-border each year, so there’s a large potential universe for conversion to rail.
In addition to these revenue opportunities, the Pacer acquisition offers significant cost synergies. Our updated estimate for synergies from the integration has tripled from our initial expectations. We now expect to realize $15 million of synergies in technology, real estate, sales and administrative functions, public company costs, and duplicative personnel – and we’ve already executed on many of them.
For example, we quickly implemented our plan to reverse the losses of Pacer’s logistics business. We closed or consolidated 16 offices and retained 10 profitable operations as part of our XPO Global Logistics freight forwarding group. Dominick Muzi, who’s done a superb job at ramping up our profitability in freight forwarding over the last three years, is now in charge of growing this combined organization.
We put the former Pacer truck brokerage business under the leadership of Josh Allen, and fully integrated it with XPO. Josh is one of our regional VPs – he’s been growing our brokerage offices in Louisville and Cincinnati at a fast clip. We moved the operations onto our proprietary Freight Optimizer technology, which has allowed the team to serve customers better and price loads more effectively. They can do their job faster on our more user-friendly system, with access to our more than 26,000 carrier relationships.
Our purchase of Pacer increased XPO’s sales and service network to approximately 3,000 employees at 123 locations. We’re facilitating more than 25,000 deliveries a day for our
2
customers, many of whom are enthusiastic about taking advantage of our expanded range of services. We’re in a strong position to leverage an important industry trend: many customers, particularly large shippers, want to winnow down their relationships to fewer, larger 3PLs with deep capacity across a range of services. We’re being responsive to the services our customers need and want by becoming a source of deep capacity across all major modes of transportation.
Those are the highlights of the Pacer acquisition and the potential upside it represents. Now let’s take a closer look at each part of our strategy and the significant growth that’s embedded in our business model.
First is scale and optimization. This starts with our industry fundamentals. The transportation logistics industry in the United States alone is about a trillion dollars annually. Over-the-road trucking is about $350 billion of that spend, with an estimated 15% penetration rate by brokers. This equates to a $50 billion opportunity that’s growing at about two to three times GDP. Currently, we have more than 14,000 customers, primarily in manufacturing, industrial, retail, commercial, life sciences and government-related accounts – yet we serve less than 2% of the addressable market.
One thing that’s likely to drive increased penetration is an outsourcing trend with both shippers and carriers. It makes economic sense for carriers to find loads through brokers instead of carrying the costs of an internal sales team. And shippers – including those with direct carrier relationships – need large 3PLs as a source of critical capacity when trucks are hard to find. We’ve positioned our company to benefit from this long-term trend. We’re building XPO not just for the $50 billion that’s going through brokers right now, but for the $300 billion that’s currently going direct from shippers to carriers.
In addition to being large and growing, our industry is highly fragmented. There are more than 10,000 licensed brokers in the U.S., but only about 25 brokerage firms with more than $200 million in revenue. Fragmentation gives us a dual benefit: it supports the acquisition leg of our strategy, and creates a competitive advantage for XPO as one of the largest brokerage firms in North America.
We’re working diligently to raise our profile in front of every prospective customer in this space. We’ve identified the 2,000 largest shippers in North America as strategic account targets. The next largest 5,000 shippers are our national account targets. In addition, there are hundreds of thousands of small and medium-sized customers who can use our services. Our branch network reaches out to them every day.
We see huge growth potential in strategic accounts. Last year, we launched a strategic accounts team to target opportunities with the largest shippers. Every one of our strategic account managers has deep industry experience, and a long track record with large shippers. They’re very attentive to the nuances of the needs of large shippers, and they’re getting a favorable response from these customers – in the first quarter alone, we’ve signed business with 33 new strategic accounts.
Our strategic accounts team includes a number of high-profile industry veterans, including Jeff Battle, Dennis McCaffrey, Greg Ritter and Jim Commiskey. Jeff is one of the key executives who led the growth of Turbo Logistics over the last two decades. Dennis has 20 years in the industry, and most recently ran the outside sales organization for our expedited transportation group. Greg was previously president of Knight Brokerage, and before that he was with C.H. Robinson for 22 years. And Jim came to us from Pacer. He has more than 20 years of transportation experience, including management positions with UPS and Menlo Worldwide.
3
Beyond strategic accounts, we’re focused on leveraging our broader multi-modal offering with customers of all sizes, both new business and existing accounts. We’re doing this in a disciplined and organized manner. All of our salespeople are on salesforce.com, and we’ve assigned a single point of contact for each customer. This gives us good visibility into the progress of sales activities, and it helps us to cross-sell our services.
Less-than-truckload is another revenue stream that’s on our doorstep. We’re taking steps to tap into this $32 billion sector in a big way. Currently, less than $25 million of our company’s annual revenue comes from LTL – yet almost all of our full truckload customers have LTL business. Our acquisition of Interide in May brought us a lot of LTL expertise, as well as an LTL technology platform that we’ve rolled out in all of our sales offices. Now that we’ve combined Interide’s carriers with our own network, we’re already getting better LTL rates. We’re very excited about the magnitude of the LTL opportunity.
Our experience tells us that the common denominator across all these lines of transportation is that customers want results. They want on-time pickup and delivery. They want their goods to arrive safely. They’re very focused on making sure that service failures don’t happen. If a problem does occur, they want to know about it right away and they want to see a solution. We get that. If you walk into one of our branch offices, you’ll see that our people are professional, efficient and on top of things.
One of the ways we empower our employees to deliver world-class service is through our information technology. We believe that our technology is a big differentiator in our industry. We have a dedicated development team in Cambridge, Mass., that focuses solely on driving innovation and the effectiveness of our systems. We design our systems to make sure they can accommodate huge scale and complex automation. They create the discipline that helps us manage rapid growth.
In 2012, we put a scalable IT platform in place across the company, with sales, service, carrier and track-and-trace capabilities. We followed that up with new pricing tools, load-covering capabilities, and the introduction of our proprietary freight optimizer software. More recently, we introduced a carrier rating engine and LTL upgrades, and enhanced our customer and carrier portals.
Our IT team has created algorithms that provide actionable pricing information and carrier procurement, as well as analytic capabilities for truckload market conditions. As we acquire lane and pricing histories from the companies we purchase, that information gets added to our database and can be used by our salespeople. For example, we can pull in real-time market data to highlight demand and availability in specific lanes and regions. This gives our salespeople price and capacity visibility across North America.
We use detailed carrier profiling that identifies each carrier’s strengths, equipment, preferred lanes and performance metrics. And we have similar profiling for our customers, that pinpoints both operational and load requirements. We also have the ability to manage our customers’ specific routing guides and tariffs, which makes us a true partner to larger accounts.
That’s an overview of part one of our strategy: scale and optimization. Part two is acquisitions. When we look at a potential acquisition, it’s more than just a financial transaction. We ask ourselves, what special value does this company bring to the table? How does it fit into XPO? Is this an operation that we can grow to many times its current size? Will the employees be exceptional additions to our organization? And most important, is it a service that our customers need and want?
4
Our acquisition of NLM, the leader in web-managed expedite logistics, gave us a strong foothold in managed transportation. We now manage more shipments in the $4 billion expedite sector than any other 3PL in North America. Our company’s roots are in expedited, which requires picking up and delivering freight very quickly, with a goal of zero service failures. Our expedite business dates back more than 20 years – so a do-or-die mindset of meeting customer needs is embedded in our DNA.
In January, we appointed Chris Healy as president of our four expedited operations: Express-1, XPO NLM, XPO Air Charter and our Gainesville, Ga., expedited office. Chris is a 30-year veteran of the transportation industry with deep experience in expedited services. He’s held senior positions with Active Aero Charter, Boyd Brothers Transportation, Caliber Logistics (now FedEx Supply Chain Services) and Roberts Express (now FedEx Custom Critical). We’re excited to have him on board.
We’re also the largest provider of last-mile logistics for heavy goods. Our acquisitions of 3PD and Optima Service Solutions have made us the largest player in this space. Last-mile is a $13 billion sector that is growing at five to six times GDP. Shippers depend on us to represent their brand during “white glove” deliveries inside a customer’s home, often with family members present. Less-than-stellar service is simply not an option. We see an opportunity to differentiate XPO on the basis of phenomenal customer service in each of our lines of business: truckload, LTL, intermodal, expedited, last-mile and freight forwarding.
Our acquisition program continues to be very lively – we’re working with a pipeline that includes prospects in most of our areas of service, with an emphasis on freight brokerage. We’ve looked at over 1,000 companies in the last couple of years, and we’ve refined that list to the 100 most attractive companies. Our acquisition team is constantly in dialogue with these targets. Many are eager to join XPO. They like our energy – they know we’re going places. For our part, we’re being very disciplined about seeking out strategically sound acquisitions that align with our core competencies.
We design each acquisition to be a win-win. Our acquired operations can sell the services of our other divisions, and we gain more carriers, customers and expertise that we can use company-wide. For example, we’ve added capabilities in LTL, last-mile, refrigerated and expedited air charter through acquisitions, as well as intermodal. Our acquisitions of Turbo, Kelron, Covered Logistics, 3PD and Pacer increased our penetration with Fortune 500 companies. The added locations give us more real-time visibility into the ebb and flow of pricing in various lanes. As a result of these synergies, our salespeople can cover loads more effectively.
This brings us to the third part of our strategy, and an important one: cold-starts. Of the 24 cold-starts we mentioned earlier, 11 are freight brokerage, including our newest location in Kansas City, which opened in March. Each location is led by a highly experienced branch president. Talent is the most important factor for cold-starts – both leadership and sales talent – so we seek to locate our new branches in prime areas for recruitment.
Even though eight of the other 10 brokerage cold-starts are barely a year old on average, and two have been open for just five months, these locations are already on an annual revenue run rate of over $190 million. A year ago, the run rate was $78 million, so we’ve grown our brokerage cold-start revenue by about 2.5 times in about 12 months, and we’ll continue to grow them fast.
5
The amount of start-up capital per cold-start is relatively slim: generally a million dollars or less. And there’s a large component of variable-based incentive compensation – so cold-starts of any size can generate extremely high returns on invested capital.
That’s our business plan. Now it comes down to operational excellence: execution and management. So let’s spend a few minutes on our senior management team.
Our CEO, Brad Jacobs, started four highly successful companies from scratch prior to XPO Logistics, and built each of those companies into a billion or multi-billion dollar enterprise. Brad and the management teams he led created dramatic shareholder value. In the process, they completed nearly 500 acquisitions and opened approximately 250 cold-starts.
The two most recent companies Brad led were United Waste Systems, which he built into the fifth largest solid waste management company in North America, and United Rentals, which he grew to be the largest construction equipment rental company in the world. From 1992, when Brad took United Waste public, to 1997, when he sold it for $2.5 billion to Waste Management, the earnings compounded at about 55% CAGR and the stock price outperformed the S&P 500 by 5.6 times. At United Rentals, over the 10 years he led the company, United Rentals stock outperformed the Index by 2.2 times.
Brad spent the better part of his first year with XPO assembling a team whose collective skill set is the perfect fit for our company’s ambitious growth strategy. For a competitor to successfully copy our business plan, it would need the deep bench of talent that we have – not just at the senior executive level, but in every key position. Here are just a few examples of our talent:
John Hardig, our chief financial officer, has been a significant presence in the transportation industry for nearly two decades. Before joining XPO, John was a managing director in the Transportation & Logistics group at Stifel Nicolaus Weisel, and an investment banker in the Transportation and Telecom groups at Alex. Brown and Sons. John has advised transportation and logistics companies on more than 60 M&A and capital market transactions. He lead-managed IPOs for C.H. Robinson and Hub Group, and he was an underwriter on equity offerings for Forward Air, Heartland Express and Knight Transportation.
Scott Malat is our chief strategy officer. He’s involved in all aspects of our company that require strategic thinking, including sales and marketing, operational benchmarking and equity market relationships. Scott knows our industry inside and out. He was the senior equity research analyst covering the air, rail, trucking and shipping sectors at Goldman Sachs prior to joining XPO. Earlier, he was an equity research analyst with UBS, and a strategy manager with JPMorgan Chase.
Troy Cooper is our senior vice president of operations and finance. Before XPO, he was responsible for integrating hundreds of acquisitions for high-growth companies in three different industries – including United Rentals and United Waste. United Rentals had the twenty-fourth largest private equipment fleet in the United States, and United Waste had the fifth largest truck fleet for solid waste collection. In addition to his strong financial skills, Troy brings disciplined oversight to our operations.
Gordon Devens is our general counsel. Gordon is more than just a talented corporate lawyer. After working at Skadden, Arps, he spent 15 years with AutoNation, where he was associate general counsel, and later led AutoNation’s deal team. Gordon has completed over 250 M&A transactions during his career, and he brings that experience to XPO’s growth strategy.
6
Mario Harik is our CIO. He was previously the CIO at Oakleaf Waste Management, a logistics provider that was sold in 2011. Mario has been tapped over the years by Fortune 100 companies for his expertise in building comprehensive IT organizations and proprietary platforms, similar to what we’re doing here at XPO. He’s put together a superstar team that is using technology in innovative ways that tie directly to customer service. They’ve accomplished a huge amount in a short period of time.
On the carrier side, Lou Amo is our vice president of carrier procurement and operations. Lou has 16 years’ experience working on both the shipper side and the carrier side in senior positions with companies like Electrolux, Union Pacific and Odyssey Logistics. Lou’s team specializes in building relationships with small and medium-sized carriers, mostly with fewer than 50 trucks. We treat our carriers respectfully and professionally, we give them miles at fair rates, and we earn their trust. In return, they work hard to make sure we fulfill our commitment to our customers: to pick up and deliver each shipment on time.
Julie Luna is our chief commercial officer, with over 25 years of industry experience. Julie was the executive vice president of sales and marketing for Pacer’s intermodal business when XPO acquired the company. Prior to Pacer, she held senior positions in sales and marketing and national account management over 23 years with Union Pacific Railroad. As UP’s vice president and general manager for Automotive, Julie led a $1.2 billion business focused on transporting automotive vehicles and parts.
Taken in its entirety, our organization is unique in the industry because it includes top talent from virtually every other major 3PL in North America. Not only do we have deep bench strength, we have a rich diversity of industry experience. We’ve assembled some of the most energetic thinkers in logistics.
Moving on to the financial picture: we more than quadrupled the size of the business in two years. We reported $177 million of revenue for 2011, and by year-end 2013 we had met our targets for a run rate of at least $1 billion and positive EBITDA in the fourth quarter. Now, with Pacer, we’ve taken another huge step forward, putting us on a run rate of approximately $2 billion. Excluding the transaction costs associated with the acquisition, we now have two straight quarters of positive EBITDA.
For the first quarter of 2014, we reported over $282 million of revenue – significantly more than expected – including year-over-year organic revenue growth of 51%. We increased our freight brokerage margin by 620 basis points, and drove revenue up 196% year-over-year. In our expedited business, we increased margin by 1,770 basis points and revenue by almost 42%. And while margin decreased 80 basis points in our freight forwarding business, revenue was up more than 20%.
For 2014, our targets are:
| • | An annual revenue run rate of at least $2.75 billion by December 31; |
| • | An annual EBITDA run rate of at least $100 million by December 31; and |
| • | At least $400 million of acquired historical annual revenue, excluding the Pacer acquisition. |
For 2017, our targets are:
| • | Revenue of approximately $7.5 billion; and |
| • | EBITDA of approximately $425 million. |
7
Finally, it’s worth noting that XPO management owns almost 30% of the company’s shares, based on the SEC beneficial ownership rules. Our interests are entirely aligned with our public shareholders to create substantial long-term value.
So to sum it up: we took a $177 million company and built it into the fourth largest freight broker in North America in two years. We’re focused on rapid, disciplined growth that makes the best use of our resources to create long-term shareholder value. We’ve established leading positions in some of the fastest-growing areas of transportation – intermodal, last-mile and expedited – with a growing presence in less-than-truckload brokerage, global freight forwarding and managed transportation. We currently facilitate more than 25,000 deliveries a day, with 123 locations that serve approximately 14,000 customers in the U.S., Canada and Mexico. We’ve assembled a management team that includes top talent from inside and outside the industry, with a skill set that’s uniquely matched to our strategy. And we have approximately 3,000 employees who are intent on making sure that our customers see XPO as an irreplaceable supply chain partner. When we look ahead, we see a clear path to grow the business far beyond our accomplishments to date. We’re excited about the future of XPO!
Thank you for your interest.
Forward-Looking Statements
This document includes forward-looking statements within the meaning of Section 27A of the Securities Act of 1933, as amended, and Section 21E of the Securities Exchange Act of 1934, as amended, including the company’s full year 2014 and full year 2017 financial targets and expected cost synergies from the Pacer integration. All statements other than statements of historical fact are, or may be deemed to be, forward-looking statements. In some cases, forward-looking statements can be identified by the use of forward-looking terms such as “anticipate,” “estimate,” “believe,” “continue,” “could,” “intend,” “may,” “plan,” “potential,” “predict,” “should,” “will,” “expect,” “objective,” “projection,” “forecast,” “goal,” “guidance,” “outlook,” “effort,” “target” or the negative of these terms or other comparable terms. However, the absence of these words does not mean that the statements are not forward-looking. These forward-looking statements are based on certain assumptions and analyses made by us in light of our experience and our perception of historical trends, current conditions and expected future developments, as well as other factors we believe are appropriate in the circumstances.
These forward-looking statements are subject to known and unknown risks, uncertainties and assumptions that may cause actual results, levels of activity, performance or achievements to be materially different from any future results, levels of activity, performance or achievements expressed or implied by such forward-looking statements. Factors that might cause or contribute to a material difference include, but are not limited to, those discussed in XPO’s filings with the SEC and the following: economic conditions generally; competition; XPO’s ability to find suitable acquisition candidates and execute its acquisition strategy; the expected impact of acquisitions, including the expected impact on XPO’s results of operations; XPO’s ability to raise debt and equity capital; XPO’s ability to attract and retain key employees to execute its growth strategy; litigation, including litigation related to alleged misclassification of independent contractors; the ability to develop and implement a suitable information technology system; the ability to maintain positive relationships with XPO’s networks of third-party transportation providers; the ability to retain XPO’s and acquired businesses’ largest customers; XPO’s ability to successfully integrate acquired businesses and realize anticipated synergies and cost savings; rail and other network changes; weather and other service disruptions; and
8
governmental regulation. All forward-looking statements set forth in this document are qualified by these cautionary statements and there can be no assurance that the actual results or developments anticipated will be realized or, even if substantially realized, that they will have the expected consequences to, or effects on, XPO or its businesses or operations. Forward-looking statements set forth in this document speak only as of the date hereof, and XPO undertakes no obligation to update forward-looking statements to reflect subsequent events or circumstances, changes in expectations or the occurrence of unanticipated events except to the extent required by law.
9