UNITED STATES
SECURITIES AND EXCHANGE COMMISSION
Washington, D.C. 20549
FORM
CURRENT REPORT
Pursuant to Section 13 or 15(d) of the
Securities Exchange Act of 1934
Date of Report
(Date of earliest event reported):
(Exact name of registrant as specified in its charter)
| (State or other jurisdiction of incorporation) |
(Commission File Number) | (I.R.S. Employer Identification No.) |
(Address of principal executive offices)
(
(Registrant’s telephone number, including area code)
Check the appropriate box below if the Form 8-K filing is intended to simultaneously satisfy the filing obligation of the registrant under any of the following provisions:
| Written communications pursuant to Rule 425 under the Securities Act (17 CFR 230.425) | ||
| Soliciting material pursuant to Rule 14a-12 under the Exchange Act (17 CFR 240.14a-12) | ||
| Pre-commencement communications pursuant to Rule 14d-2(b) under the Exchange Act (17 CFR 240.14d-2(b)) | ||
| Pre-commencement communications pursuant to Rule 13e-4(c) under the Exchange Act (17 CFR 240.13e-4(c)) |
Securities registered pursuant to Section 12(b) of the Act:
| Title of each class | Trading symbol(s) | Name of each exchange on which registered | ||
| Indicate by check mark whether the registrant is an emerging growth company as defined in as defined in Rule 405 of the Securities Act of 1933 (§230.405 of this chapter) or Rule 12b-2 of the Securities Exchange Act of 1934 (§240.12b-2 of this chapter). |
| Emerging growth company |
| If an emerging growth company, indicate by check mark if the registrant has elected not to use the extended transition period for complying with any new or revised financial accounting standards provided pursuant to Section 13(a) of the Exchange Act. ¨ |
Item 7.01. Regulation FD Disclosure.
On May 3, 2021, XPO Logistics, Inc. (the “Company”) released a slide presentation expected to be used by the Company in connection with certain future investor presentations, together with a corresponding script. Copies of the script and slide presentation are attached as Exhibit 99.1 and Exhibit 99.2, respectively, to this Current Report on Form 8-K.
The slide presentation and script should be read together and with the Company’s filings with the Securities and Exchange Commission, including the Quarterly Report on Form 10-Q for the fiscal quarter ended March 31, 2021.
The information furnished in this Item 7.01, including Exhibit 99.1 and Exhibit 99.2, shall not be deemed “filed” for purposes of Section 18 of the Securities Exchange Act of 1934, as amended (the “Exchange Act”), or otherwise subject to the liabilities of that Section, and shall not be deemed to be incorporated by reference into any filing of the Company under the Exchange Act or the Securities Act of 1933, as amended, except to the extent that the registrant specifically incorporates any such information by reference.
| Item 9.01. | Financial Statements and Exhibits. | |
(d) Exhibits
| Exhibit No. | Exhibit Description | |||
| 99.1 | Investor Presentation Script, dated May 3, 2021 | |||
| 99.2 | Investor Presentation, dated May 3, 2021 | |||
| 104 | Cover Page Interactive Data File (embedded within the Inline XBRL document) | |||
SIGNATURE
Pursuant to the requirements of the Securities Exchange Act of 1934, the registrant has duly caused this report to be signed on its behalf by the undersigned hereunto duly authorized.
| Date: May 3, 2021 | XPO LOGISTICS, INC. | |
| By: | /s/ Karlis P. Kirsis | |
| Karlis P. Kirsis | ||
| Corporate Secretary | ||
|
Exhibit 99.1 |

May 3, 2021
Presentation Script and Slides
The following script should be read in conjunction with the accompanying slide presentation, which contains, among other information, source data for certain information set forth in the script.
Thank you for joining us. We’ll start with an overview of XPO Logistics today, and our strategy for driving growth, competitive differentiation and financial returns. We’ll also bring you up to date on some recent developments, including the planned spin-off of our logistics business. And we’ll give you an overview of our record first quarter financial performance, which further increased our momentum after a dramatic rebound from the impact of COVID-19 in 2020.
XPO is one of the largest providers of supply chain services in the world, with over $16 billion in 2020 revenue and an integrated network of people, technology and physical assets. We have 1,621 locations in 30 countries and approximately 140,000 team members, comprised of 108,000 employees and 32,000 temporary workers. We use our network to help over 50,000 customers operate their supply chains most efficiently.
Our company has two reporting segments: transportation and logistics, each with leadership positions and robust growth prospects. In our transportation segment, we’re a top three less-than-truckload (LTL) provider in North America and the second largest freight brokerage provider globally. In our logistics segment, we’re the second largest contract logistics provider worldwide. Within each segment, our markets are highly diversified and we’re positioned to capitalize on fast-growing areas of demand. Approximately 62% of our 2020 revenue came from our transportation segment, and the remaining 38% came from our logistics segment.
In December, we announced that we plan to spin off our logistics segment later this year as a separate publicly traded company. The spin-off — named GXO Logistics — will create two, pure-play industry leaders: GXO will be the second largest contract logistics provider in the world, and the remaining company will be a global provider of less-than-truckload and truck brokerage transportation services. We expect to complete the transaction in the second half of 2021.
We’re confident that the spin-off, if completed as planned, will enhance the growth prospects of both businesses. Each company will have greater flexibility to tailor strategic decision-making and capital allocations to their end-markets, with the benefit of strong positioning as customer-focused innovators. Each will have its own investor base and pure-play equity currency it can use to attract and retain world-class talent and pursue M&A. We’re in discussions with the rating agencies about our plan to achieve an investment-grade rating for GXO from day one, with XPO to follow.
1
The spin-off transaction is subject to various conditions, and may or may not occur, or its terms or timing may be different than originally planned.
Investor Highlights
These are the key factors driving our growth and returns companywide:
| · | We’re a global leader in logistics and truck brokerage, and a North American leader in less-than-truckload (LTL) transportation, with outsized exposure in verticals that have a history of enduring demand. |
| · | Our value proposition is a combination of scale, density, expertise and technology that gives us expansive opportunities for organic growth and share gains through accretive M&A. |
| · | In logistics, we’re strongly positioned to benefit from the industry’s predominant tailwinds — e-commerce and omnichannel retail, the shift toward supply chain outsourcing and warehouse automation. |
| · | In transportation, we have a best-in-class digital brokerage platform that’s driving profitable growth, while in LTL, our technology is expanding our margin, while the start of the rebound in the industrial economy is stimulating demand for our services. |
| · | Our rapid pace of innovation differentiates our service offerings and makes the most of the talent and assets within our organization. |
| · | Our scale gives us significant operating leverage, purchasing power, the capacity to innovate and the ability to deliver consistent outcomes across multiple markets for large customers. |
| · | We’re nimble allocators of capital, with a disciplined focus on returns and an enviable record of creating substantial shareholder value. |
| · | We serve customers in diverse verticals with complementary demand patterns, and the majority of our revenue is generated under long-term contracts, making our performance more resilient in economic cycles. |
| · | Our business model is optimized for free cash flow generation in all parts of the cycle; about 70% of our revenue is asset-light, with low maintenance capex. |
| · | Our secret sauce has always been the world-class people we attract to XPO — not just our 35 most senior executives, but also the 2,500 professionals at the next level with blue-chip industry experience. |
Technology Overview
One of the ways we strengthen our relationships with customers is by empowering our employees to deliver superior service through our technology. Our industry is evolving, and customers want to de-risk their supply chains with more automation and better visibility into the movement of their goods. We’re already well-positioned to meet this demand, because we prioritized digitization and visibility early in our technological development.
We’ve built a highly scalable platform on the cloud that speeds the deployment of new ways to increase efficiency, control costs and leverage our footprint. We can deploy innovations across multiple geographies in a relatively short time, and also take an innovation developed for one vertical and apply it to other verticals to differentiate the value we offer.
2
We believe that our investment in technology is among the highest in our industry at an annual average of about $500 million. We’re happy to make that commitment, because technology is a high-ROI investment for us, and one that drives our competitive advantage in both transportation and logistics. When our logistics segment spins off as GXO, it will continue to use the intellectual property we’ve developed for those operations through IP assignments and licensing agreements.
The supply chain industry is wide open for disruptive thinking and we’re driving positive change. The most significant impacts of our technology to date are in these four areas:
XPO Smart™
XPO Smart™ is our proprietary suite of workforce planning tools that improve productivity in our logistics sites and LTL docks. The tools help our site managers determine the best staffing levels by shift, day and week, with the optimal mix of full- and part-time labor. Our proprietary analytics “learn” the operations of a specific site and can forecast how a labor management decision today could affect productivity in a future period.
We’re seeing an average 5% to 7% productivity improvement from XPO Smart™ as we optimize our labor management in a safe and disciplined manner. To date, the tools have been implemented in 100% of our LTL dock operations, over 85% of our North American logistics sites and about 60% of our European logistics sites, with further roll-outs underway. We expect to realize a significant upside from these implementations as we fully utilize XPO Smart™ in our operations.
Intelligent warehouse automation
Intelligent warehouse automation is a priority for our logistics segment. This includes autonomous robots and collaborative robots (cobots), automated sortation systems, automated guided vehicles, goods-to-person systems and wearable smart devices. We integrate these technologies into our operations and control them in-house with our proprietary warehouse management system.
Advanced automation, robotics and autonomous goods-to-person systems are particularly effective in delivering critical improvements in speed, accuracy and productivity. Importantly, automation also enhances safety and the overall quality of employment.
In mid-2020, we opened a fully automated Digital Distribution Warehouse of the Future in the UK, which we co-developed with Nestlé, the world’s largest food and beverage company. This site has the capacity to process more than a million pallets per year — the highest throughput of any facility in Nestlé’s global network. Our European innovation lab is based on the premises, where it functions as both a think tank and a test site for new technologies.
XPO Connect™
XPO Connect™ is our proprietary digital platform that fully automates transportation procurement — it encompasses our Freight Optimizer system, shipper interface, pricing engine, carrier interface and our carrier mobile app. When our customers have truckload freight to move, we use this powerful technology to find the optimal carrier based on a number of parameters, including price, market conditions and load profile.
3
Our investment in digitization is making our brokerage business much more efficient and reducing our costs. It enables us to capture share and elevate customer service without large increases in headcount. The technology gives our customers to the flexibility to source reliable truckload capacity at the optimal price, gain insights into market conditions and tender loads at their convenience. Carriers can increase their income and reduce empty miles by having their drivers bid on loads from their trucks, using our mobile app.
In the first quarter, we topped 81,000 truck carriers registered on XPO Connect™, which is an increase of 50% year-over-year. In April, we surpassed 400,000 truck driver downloads of the platform’s mobile app, up from 300,000 just three months earlier.
LTL optimization
In less-than-truckload, we’re growing our margin by innovating the way we operate. LTL is a rock-solid industry with strong fundamentals, which gives us the ability to focus our technology on optimizing specific components of the service we provide — primarily linehaul, pickup-and-delivery, pricing and dock productivity. For instance, with intelligent route-building, we can reduce empty miles in our linehaul network and mitigate cargo damage. To boost trailer utilization, our proprietary algorithms arrive at recommendations to fill trailer gaps based on volume and density, taking freight dimensions into account.
Our North American LTL linehaul network moved freight approximately 2.3 million miles a day on average in 2020, which is an enormous lever for efficiency and profitability. From 2015 to 2020, we improved the operating margin by 960 basis points, and we believe there’s a lot more we can gain.
Company Overview
We created XPO in 2011 to provide exceptional value for our customers while generating meaningful returns for our shareholders. The supply chain industry is vast, growing, fragmented and ripe for innovation, with underpenetrated sectors.
Supply chains are unique by nature. Each one is a network spanning every step a company must take to move its goods from the origin to the end-user. Our customers typically have supply chains that include vendors, manufacturers, labor, assets, technologies, data and other resources.
Our service offering is asset-light overall, with assets accounting for less than a third of revenue. In 2020, our net capex was 2% of revenue — a notably lower percentage than asset-intensive competitor groups in our industry, such as less-than-truckload, truckload, parcel and rail carriers. The assets we do own or lease are critical components of the customer services we provide, such as 885 logistics sites, and on the transportation side, 552 cross-docks and approximately 13,000 tractors and 35,000 trailers.
We market our service offerings using a two-pronged sales strategy: earn a greater share of wallet with our existing customer base and further penetrate high-growth verticals where our expertise and track record give us an advantage.
4
Over the past three years, we deepened our bench strength of senior-level sales talent in transportation and logistics in both North America and Europe. We also invested in new training and analytics for our salesforce and sales support personnel in North American LTL.
Overview of Logistics Operations
XPO is at the forefront of a $130 billion logistics industry in North America and Europe combined, of which we have about a 5% share. Our customers include many of the largest and most respected brands in the world — market leaders, such as Apple, Boeing, Coca Cola, Intel, L'Oréal, Nestlé and Nike. The average tenure of our top 20 logistics customers is 15 years.
Our logistics services are differentiated by our ability to deliver technology-enabled, customized solutions, vertical expertise, sophisticated engineering and scale — all of which make us attractive to national and multinational customers. Our footprint stands at approximately 210 million square feet (20 million square meters) of warehouse space.
Within our logistics segment, which we sometimes refer to as supply chain or contract logistics, we’ve identified these key drivers of value creation:
| · | Our strong positioning with blue-chip customers who require bespoke solutions, and our ability to grow with them, making a compelling case for outsourcing to us; |
| · | Leading capabilities for e-commerce and reverse logistics management, including the largest outsourced e-fulfillment platform in Europe and expansive capabilities for e-fulfillment, omnichannel logistics and returns management in North America; |
| · | Our robust technological differentiation, including our proprietary warehouse management platform that integrates robotics and other advanced automation to facilitate agility, visibility, speed, accuracy and control; |
| · | Our XPO Direct™ network — an innovative, shared-space distribution solution that gives customers a fluid way to position inventory close to target populations, reducing fixed costs and transit times; |
| · | A large opportunity to grow share in established specializations where we have a longstanding presence and relationships with sectors leaders; and |
| · | Significant levers for profitable growth and substantial free cash flow, with a long runway for margin expansion. |
Our logistics customers primarily operate in industries that are well-suited for outsourcing, including e-commerce and retail, food and beverage, consumer packaged goods, technology, aerospace, telecommunications, industrial and manufacturing, chemicals, agribusiness, life sciences and healthcare. These are all verticals where we have deep expertise and understand the specific requirements, such as special handling, complex stock-keeping, time-assured deliveries and surge management.
The e-commerce sector, in particular, continues to demonstrate strong, secular growth. Before COVID-19, e-commerce was already growing globally at a double-digit rate, and that growth has accelerated as more consumers opt to purchase goods online. Many retailers, e-tailers and direct-to-consumer manufacturers find it difficult to handle high volumes in-house without compromising service. The solutions we provide allow our customers to focus on their competencies and grow with confidence.
5
Many of our e-commerce facilities also manage merchandise returns, known as reverse logistics. This is one of the most highly valued services across multiple customer verticals. Reverse logistics services have become mission-critical for companies with consumer end-markets, as shoppers increasingly test-drive the products they buy online. Depending on the merchandise being returned, our services can include inspection, testing, repackaging, refurbishment, resale or product disposal, as well as refunding and warranty management.
Logistics processes overall are ripe for transformation through technology. Order fulfillment times are compressing, most notably in the direct-to-consumer space. The most cost-effective way to meet the majority of customer expectations is through advanced automation and intelligent machines — robots and cobots, automated sortation systems, automated guided vehicles and goods-to-person systems, which bring inventory to workers for order fulfillment.
We’ve been integrating collaborative robotics and goods-to-person systems into a number of our warehouses to support our employees and improve efficiency. We’re accelerating our deployment of automation, and this is substantially increasing throughput. In 2020, we shipped five times more product units using advanced warehouse robots than we did in 2019.
Robotics are particularly valuable in tight labor markets where wage inflation and labor shortages can erode customer margins. We’ve found that autonomous goods-to-person systems can improve productivity by 4-6x. Cobots, which assist workers with the inventory picking process, have a 2x benefit to productivity on average. Stationary robot arms can repeat demanding tasks with precision 3x faster than would be possible manually.
About 15% to 35% of consumer goods bought online are returned, depending on the product category. This creates peaks in returns at certain times of year. We’ve been able to shave several days off the reverse process through automation, which accelerates a customer’s ability to return goods to retail for sale.
In addition to our investments in automation and analytics, we’ve differentiated XPO from other logistics providers through our ability to create a synchronized warehouse environment across automation solutions. Our proprietary warehouse management platform integrates robotics and other advanced automation into our operations with rigorous control, even when complex, third-party software is involved.
Our XPO Smart™ workforce management tools are integrated into our warehouse ecosystem and deployed on the cloud. As logistics volumes fluctuate, our site leaders are able to make rapid adjustments to labor levels and improve productivity in real time.
XPO Direct™
XPO Direct™ is our shared-space distribution network for B2C and B2B customers in North America. This unique solution gives retailers, e-tailers and manufacturers a way to manage fulfillment using our scale, capacity and innovation without the need to add high-fixed-cost distribution centers. Our technology links our facilities, which serve as strategically located stockholding sites and cross-docks that can be utilized by multiple customers at the same time.
XPO Direct™ gives customers the flexibility to reposition inventory within one-day and two-day ground delivery range of approximately 99% of the U.S. population as demand patterns change, and in close proximity to retail stores for inventory replenishment. It gives our customers a strategic way to respond to consumer expectations for shorter fulfillment times and greater service agility. In addition, our customers have the use of our technology for distribution management and our analytics for demand forecasting.
6
Overview of Transportation Operations
Our other segment — transportation — derives the vast majority of its revenue and profit from less-than-truckload transportation, our largest transportation service line, and truck brokerage.
Less-Than-Truckload (LTL)
The company-specific drivers of growth and margin in our LTL business are:
| · | Critical capacity and national lane density as the #3 LTL provider in North America, the #1 provider in France and Spain, and the #3 provider in the UK; |
| · | Sizable opportunities to further improve profitability beyond the significant gains we’ve already made by using our intelligent technology to optimize linehaul, pickup-and-delivery, pricing and variable labor spend; |
| · | Favorable industry fundamentals, including rational pricing dynamics in North America and the start of a recovery in industrial demand; and |
| · | Over 30 years’ experience and deep relationships with customers and partners in our domestic, cross-border and international networks. |
Our LTL operations in North America are asset-based. We provide customers with geographic density and day-definite regional, inter-regional and transcontinental LTL freight services with one of the industry’s largest fleets of tractors and trailers, professional drivers and a national network of terminals. This includes cross-border US service to and from Mexico and Canada, as well as intra-Canada service.
We doubled EBITDA in North American LTL within four years of acquiring this business in 2015, and we’ve brought the operation a long way forward. In the first quarter of 2021, our operating ratio was 84.9% and our adjusted operating ratio was 82.6%. Excluding gains from sales of real estate, our LTL adjusted operating ratio improved 220 basis points year-over-year to 84.3%. We’re on track to deliver at least $1 billion of LTL adjusted EBITDA in 2022.
Our LTL team is laser-focused on on-time, damage-free performance. Using one of the industry’s most modern fleets, we delivered approximately 12.4 million shipments in 2020. We have over 20,000 LTL customers in North America alone, primarily local accounts, and we’re diversifying our base by selling this service across more verticals.
Our linehaul network is how we move LTL freight across the country. We use intelligent route-building to increase linehaul fleet utilization, optimize load factor and limit cargo damage. To improve pickup-and-delivery performance, we developed routing and visualization tools that help our dispatchers leverage route density and reduce cost per stop. To optimize pricing, we use elasticity models to adjust for current lane conditions. And we use XPO Smart™ in our yard and dock operations to enhance productivity.
While each application of our technology delivers its own benefits, we also expect a strong synergistic effect on our LTL business as a whole. For example, when we optimize truck routes, this benefits asset utilization, driver utilization, customer service and yield, and should reduce our carbon footprint.
7
In Europe, where we’re a leading provider of LTL service in key markets, we utilize a blend of operations that includes asset-based (XPO fleet) and asset-light (contracted carriers), supported by a network of terminals. We have approximately 100 LTL locations serving countries across Europe, and we deliver over 61,000 pallets daily.
Truck Brokerage
Our truck brokerage business has a long track record of outperformance — from 2013 through 2019, in the US, our revenue CAGR of 22% was more than three times the brokerage industry revenue CAGR of 7%. Our growth is being propelled by our scale and technology, and by favorable industry tailwinds:
| · | We offer customers critical capacity on a large scale as the #2 brokerage provider globally, the #3 broker in North America, and a top three transportation company across the UK, France, Spain, Portugal and Morocco; |
| · | Key secular trends are creating growth opportunities for us, including the growing demand for truckload capacity in the e-commerce and omnichannel retail sectors. Another trend is that shippers are increasingly outsourcing to brokers — particularly brokers with digital capabilities like XPO; |
| · | We have the opportunity to unlock incremental revenue and profit well beyond current levels through our XPO Connect™ digital marketplace, and capture high-margin opportunities with our pricing technology; and |
| · | Our long-tenured relationships with blue-chip customers are an opportunity to grow wallet share and leverage our reputation in key verticals. |
Our truck brokerage business has a nimble, non-asset model with a variable labor structure that generates substantial return on investment. We can reduce our costs when demand is soft and flex our resources to find trucks as demand returns. Essentially, we place shippers’ freight with qualified carriers, primarily trucking companies. This service is priced for shippers on either a spot market or contract basis. Customers offer loads to us daily via electronic data interchange, APIs, email, telephone and our XPO Connect™ platform.
As of March 31, 2021, we had approximately 81,000 independent carriers in our global brokerage network, giving us access to more than a million trucks. This enormous truckload capacity is a huge differentiator for us, together with our veteran brokerage leaders and our best-in-class technology.
XPO Connect™ has become one of the most rapidly adopted technologies in the brokerage industry. The value of the platform grows exponentially with every customer, carrier and transaction it touches. Importantly, it continually improves our brokerage service through automation, giving us the ability to manage volume growth without eroding margin.
Our transportation segment also includes an asset-light last mile logistics service for the home delivery of heavy goods — another sector that’s benefitting from the rapid expansion of e-commerce and omnichannel retail. XPO is the largest provider of last mile logistics for heavy goods in North America, with a growing last mile presence in Europe.
8
A Culture with Purpose
In conveying our strengths, we believe that equal weight should be given to the human face of XPO. Our company employs over 100,000 extraordinary individuals who have great insights about our customers and our business. The past year was trying at times, but it also brought out the best in Team XPO — our people showed true professionalism by keeping goods moving through supply chains for customers during the pandemic. They know that XPO is 100% committed to their safety.
Our culture is also about being respectful, entrepreneurial, innovative and inclusive. It's about having compassion, being honest and respecting diverse points of view, while operating as a team. We foster emotional safety at work, with robust ethical guidelines that clearly define prohibited behavior, such as harassment, dishonesty, discrimination, workplace violence, bullying, conflicts of interest, insider trading and human trafficking.
In 2020, we created the role of chief diversity officer, and we routinely reinforce the importance of diversity in our culture through open-door management, the XPO University training curriculum, our Workplace virtual community and equal opportunity hiring policies. We also support diverse causes important to our employees, such as Soles4Souls, Girls With Impact, Workfit programs for differently-abled people and the Susan G. Komen Foundation’s fight against breast cancer. We’re proud to be the official transportation partner for the 2021 Susan G. Komen 3-Day Walks®.
Our Pregnancy Care Policy is a gold standard not just for our industry, but for any industry. Any employee of XPO, female or male, who becomes a new parent through birth or adoption can qualify for six weeks of 100% paid leave as the infant's primary caregiver, or two weeks paid leave as the secondary caregiver. In addition, a woman receives up to 20 days of 100% paid prenatal leave for health and wellness and other preparations for her child's arrival.
Our women employees can request pregnancy accommodations without fear of discrimination. This includes "automatic yes" accommodations, such as changes to work schedules and the timing or frequency of breaks, or assistance with certain tasks. More extensive accommodations are easily determined with input from a doctor. Furthermore, we guarantee that a woman will continue to be paid her regular base wage rate while her pregnancy accommodations are in effect, even if her duties need to be adjusted, and she will remain eligible for wage increases while receiving alternate work arrangements.
We’ve also partnered with a leading healthcare network for women and families to offer supplemental health services from over 1,400 practitioners in 20 specialties via a virtual clinic. In total, more than 30 quality benefits are available to XPO women and families in the US. These include fertility services, prenatal and postpartum care, paid family bonding and a return-to-work program.
Environmental Sustainability
Environmental sustainability remains a significant priority for us. In the US, XPO has been named a Top 75 Green Supply Chain Partner by Inbound Logistics for five consecutive years. In France, we’ve renewed our commitment to the CO2 Charter for another three years. In Spain, all of our sites meet LEED energy certification standards for 100% consumption of renewable energy.
9
A number of our logistics warehouses are ISO 14001-certified, which ensures environmental and other regulatory compliances. The groundbreaking logistics site we created with Nestlé is operating with environmentally friendly ammonia refrigeration systems, energy-saving lighting, air-source heat pumps for administration areas and rainwater harvesting.
We monitor fuel emissions from forklifts, with protocols in place to take immediate corrective action if needed. Our packaging engineers ensure that the optimal carton size is used for each product slated for distribution, and when feasible, we purchase recycled packaging. As a byproduct of managing returned merchandise, we recycle millions of electronic components and batteries each year.
In our transportation segment, we’ve made substantial investments in fuel-efficient Freightliner Cascadia tractors in North America; these use EPA 2013-compliant and Greenhouse Gas 2014-compliant selective catalytic reduction (SCR) technology. Our North American LTL locations have energy-saving policies in place and are implementing a phased upgrade to LED lighting.
Our modern road fleet in Europe is 98% compliant with Euro V, EEV and Euro VI standards. We also own over 250 natural gas trucks operating in France, the UK, Spain and Portugal, including 80 tractors we purchased in 2020 that use liquified natural gas (LNG). In Spain, we own government-approved mega-trucks to transport freight with fewer trips, and our last mile operations in Europe use electric vehicles for deliveries in certain urban areas, reducing those emissions to zero.
The development of our culture will continue to be a steady march forward, as it has since our founding in 2011. Our Sustainability Report provides details of our global progress in key areas, including safety, employee engagement, diversity and inclusion, ethics and compliance, environmental protection and governance. The latest report can be downloaded from https://sustainability.xpo.com.
First Quarter 2021 Financial Highlights1
In the first quarter, we reported the highest revenue of any quarter in our history, appreciably outpacing a macro that’s recovering faster than expected. Our net income and adjusted EBITDA were both first quarter records.
Our truck brokerage business is continuing to outperform the market, powered by the growth of our XPO Connect™ digital platform. Our LTL business has strong momentum; industrial demand is rebounding and our technology is continuing to drive margin improvement. In logistics, our record first quarter revenue of $1.82 billion was propelled by the “big three” logistics tailwinds: e-commerce, outsourcing and warehouse automation.
Financial highlights for the quarter are:
| · | $4.77 billion of revenue |
| · | $202 million of operating income |
| · | $115 million of net income2 |
1 Reconciliations of non-GAAP financial measures used in this document are provided in the accompanying slide presentation
2 Net income attributable to common shareholders
10
| · | $1.02 diluted earnings per share |
| · | $164 million of adjusted net income2 |
| · | $1.46 adjusted diluted earnings per share |
| · | $443 million of adjusted EBITDA |
| · | $173 million of cash flow from operations |
| · | $69 million of free cash flow |
Raises 2022 Guidance
The company issued new full year 2021 targets on May 3, 2021:
| · | Adjusted EBITDA of $1.825 billion to $1.875 billion, compared with the prior guidance of $1.725 billion to $1.8 billion. The new range for adjusted EBITDA reflects a year-over-year increase in adjusted EBITDA of 31% to 35% from 2020, comprised of: |
| – | 28% to 32% growth in adjusted EBITDA in the logistics segment; and |
| – | 30% to 34% growth in adjusted EBITDA in the transportation segment. |
| · | Depreciation and amortization of $625 million to $645 million, excluding $145 million of acquisition-related amortization expense; |
| · | Interest expense of $270 million to $280 million; |
| · | Effective tax rate of 24% to 26%; and |
| · | Adjusted diluted EPS of $5.90 to $6.50, up from the prior range of $5.10 to $5.85. |
With respect to 2021 cash flows, the company issued the following targets:
| · | Gross capital expenditures of $650 million to $700 million, up from the prior range of $625 million to $675 million; |
| · | Net capital expenditures of $500 million to $550 million, up from the prior range of $475 million to $525 million; and |
| · | Free cash flow of $650 million to $725 million, up from the prior range of $600 million to $700 million. |
2021 guidance excludes impacts associated with our planned spin-off of the logistics segment; and assumes 113 million diluted shares outstanding.
Liquidity Position
On March 31, 2021, we had access to approximately $1.7 billion of total liquidity, including $629 million of cash and cash equivalents and $1.1 billion of available borrowing capacity. The company has no significant debt maturing until mid-2023.
In January 2021, we redeemed $1.2 billion of 6.5% Senior Notes due 2022, using available cash, at a price of 100% of the principal amount plus accrued and unpaid interest.
11
Strong Momentum Going Forward
We’re continuing to execute our growth strategy by running the business efficiently, while remaining responsive to changes in our operating environment. This disciplined focus is a major reason why nearly 70% of Fortune 100 companies rely on our services.
When we receive awards for excellence from world-class companies, such as Boeing, Corteva, Diebold, Dow, Ford, GM, Nissan, Nordstrom, Owens Corning, Raytheon, The Home Depot and Whirlpool, we know we’re doing our job.
Our contract with the Tour de France as its official transportation partner has been extended through 2024. This will be the 41st consecutive year we partner with the Tour, and we take great pride in supporting our customer on the world stage. Recently, we were named the official logistics partner for the prestigious IRONMAN triathlons in Europe; our multi-year agreement will commence with our support of more than 20 competitive events this year.
In 2016, we made the Fortune 500 list for the first time, and one year later, XPO was named the fastest-growing transportation company on the list. In 2018, Fortune named us to their Fortune Future 50 list. Gartner has ranked us as a Magic Quadrant 3PL leader for four consecutive years. In Italy, we’ve been awarded Logistics Company of the Year for innovation three times. Logistics Manager named us 3PL of the Year, and both the Netherlands and France ranked us in the top three 3PLs in their respective countries. Forbes ranked us as the top-performing US company on the Global 2000 and one of the best employers in the US.
In February, Fortune named us one of the World's Most Admired Companies for the fourth straight year. And in April, Forbes again named us one of Spain’s best companies to work for. The Financial Times has honored us as a European Diversity Leader, and in 2020, we were named a Winning “W” Company by 2020 Women on Boards for the gender diversity of our board of directors. Newsweek ranked us in the top 100 of America's most responsible companies, and Statista named us one of the most socially responsible companies in France. In the UK, XPO was voted one of Glassdoor’s top three best places to work. We thank our employees for creating the culture that has led to these recognitions.
Now we have the industry’s biggest tailwinds at our back in 2021. Based on a first quarter that solidly beat expectations, and the positive sentiment we hear from our customers, we raised our 2021 guidance for adjusted EBITDA to $1.825 to $1.875 billion, which represents 31% to 35% EBITDA growth year-over-year.
In the near-term, we’ll continue to build our GXO leadership team, following our appointment of eight world-class C-suite executives to date. We’re making excellent progress on the spin-off plan overall, including the filing of our confidential initial Form 10 in March.
There are a lot of reasons to feel bullish about 2021, and we’re off to a very strong start.
Thank you for your interest!
12
Non-GAAP Financial Measures
As required by the rules of the Securities and Exchange Commission (“SEC”), we provide reconciliations of the non-GAAP financial measures contained in this document to the most directly comparable measure under GAAP, which are set forth in the financial tables attached to the accompanying slide presentation.
XPO’s non-GAAP financial measures used in this document include: adjusted earnings before interest, taxes, depreciation and amortization (“adjusted EBITDA”) and adjusted EBITDA margin for the three-month periods ended March 31, 2021 and 2020 on a consolidated basis; adjusted EBITDA and adjusted EBITDA excluding truckload for the twelve-month periods ended December 31, 2020, 2019, 2018, 2017, 2016 and 2015; free cash flow for the three-month periods ended March 31, 2021 and 2020, and the twelve-month periods ended December 31, 2020, 2019, 2018, 2017, 2016 and 2015; adjusted net income attributable to common shareholders and adjusted earnings per share (basic and diluted) (“adjusted EPS”) for the three-month periods ended March 31, 2021 and 2020; adjusted EBITDA, adjusted operating income and adjusted operating ratio for our North American less-than-truckload business for the three-month periods ended March 31, 2021 and 2020 and the twelve-month periods ended December 31, 2020, 2019, 2018, 2017, 2016 and 2015; and net debt and net leverage as of March 31, 2021.
We believe that the above adjusted financial measures facilitate analysis of our ongoing business operations because they exclude items that may not be reflective of, or are unrelated to, XPO and its business segments’ core operating performance, and may assist investors with comparisons to prior periods and assessing trends in our underlying businesses. Other companies may calculate these non-GAAP financial measures differently, and therefore our measures may not be comparable to similarly titled measures of other companies. These non-GAAP financial measures should only be used as supplemental measures of our operating performance.
Adjusted EBITDA, adjusted net income attributable to common shareholders and adjusted EPS include adjustments for transaction and integration costs, as well as restructuring costs and other adjustments as set forth in the attached tables. Transaction and integration adjustments are generally incremental costs that result from an actual or planned acquisition, divestiture or spin-off and may include transaction costs, consulting fees, retention awards, and internal salaries and wages (to the extent the individuals are assigned full-time to integration and transformation activities) and certain costs related to integrating and converging IT systems. Restructuring costs primarily relate to severance costs associated with business optimization initiatives. Management uses these non-GAAP financial measures in making financial, operating and planning decisions and evaluating XPO’s and each business segment’s ongoing performance.
We believe that free cash flow is an important measure of our ability to repay maturing debt or fund other uses of capital that we believe will enhance stockholder value. We calculate free cash flow as net cash provided by operating activities, less payment for purchases of property and equipment plus proceeds from sale of property and equipment. We believe that adjusted EBITDA, adjusted EBITDA margin and adjusted EBITDA excluding truckload improve comparability from period to period by removing the impact of our capital structure (interest and financing expenses), asset base (depreciation and amortization), tax impacts and other adjustments as set out in the attached tables that management has determined are not reflective of core operating activities and thereby assist investors with assessing trends in our underlying businesses. We believe that adjusted net income attributable to common shareholders and adjusted EPS improve the comparability of our operating results from period to period by removing the impact of certain costs and gains that management has determined are not reflective of our core operating activities, including amortization of acquisition-related intangible assets. We believe that adjusted operating income and adjusted operating ratio for our North American less-than-truckload business improve the comparability of our operating results from period to period by (i) removing the impact of certain transaction and integration and restructuring costs, as well as amortization expenses and (ii) including the impact of pension income incurred in the reporting period as set out in the attached tables. We believe that net debt and net leverage are important measures of our overall liquidity position and are calculated by removing cash and cash equivalents from our reported total debt and reporting net debt as a ratio of our last twelve-month reported adjusted EBITDA.
13
With respect to our full year 2021 financial targets for adjusted EBITDA, adjusted diluted EPS and free cash flow, a reconciliation of these non-GAAP measures to the corresponding GAAP measures is not available without unreasonable effort due to the variability and complexity of the reconciling items described above that we exclude from these non-GAAP target measures. The variability of these items may have a significant impact on our future GAAP financial results and, as a result, we are unable to prepare the forward-looking statement of income and statement of cash flows prepared in accordance with GAAP that would be required to produce such a reconciliation.
Forward-looking Statements
This document includes forward-looking statements within the meaning of Section 27A of the Securities Act of 1933, as amended, and Section 21E of the Securities Exchange Act of 1934, as amended, including our future growth prospects for EBITDA in our North American less-than-truckload business, our company's potential profit growth opportunity, our company’s full year 2021 financial targets for adjusted EBITDA, depreciation and amortization (excluding acquisition-related amortization expense), interest expense, effective tax rate, adjusted diluted EPS, gross capital expenditures, net capital expenditures and free cash flow, as well as our company’s planned spin-off of its logistics segment and its plan to pursue an investment-grade credit rating. All statements other than statements of historical fact are, or may be deemed to be, forward-looking statements. In some cases, forward-looking statements can be identified by the use of forward-looking terms such as “anticipate,” “estimate,” “believe,” “continue,” “could,” “intend,” “may,” “plan,” “potential,” “predict,” “should,” “will,” “expect,” “objective,” “projection,” “forecast,” “goal,” “guidance,” “outlook,” “effort,” “target,” “trajectory” or the negative of these terms or other comparable terms. However, the absence of these words does not mean that the statements are not forward-looking. These forward-looking statements are based on certain assumptions and analyses made by us in light of our experience and our perception of historical trends, current conditions and expected future developments, as well as other factors we believe are appropriate in the circumstances.
14
These forward-looking statements are subject to known and unknown risks, uncertainties and assumptions that may cause actual results, levels of activity, performance or achievements to be materially different from any future results, levels of activity, performance or achievements expressed or implied by such forward-looking statements. Factors that might cause or contribute to a material difference include the risks discussed in our filings with the SEC and the following: economic conditions generally; the severity, magnitude, duration and aftereffects of the COVID-19 pandemic and government responses to the COVID-19 pandemic; our ability to align our investments in capital assets, including equipment, service centers and warehouses, to our customers’ demands; our ability to implement our cost and revenue initiatives; our ability to successfully integrate and realize anticipated synergies, cost savings and profit improvement opportunities with respect to acquired companies; matters related to our intellectual property rights; fluctuations in currency exchange rates; fuel price and fuel surcharge changes; natural disasters, terrorist attacks or similar incidents; risks and uncertainties regarding the potential timing and expected benefits of the proposed spin-off of our logistics segment, including final approval for the proposed spin-off and the risk that the spin-off may not be completed on the terms or timeline currently contemplated, if at all; the impact of the proposed spin-off on the size and business diversity of our company; the ability of the proposed spin-off to qualify for tax-free treatment for U.S. federal income tax purposes; our ability to develop and implement suitable information technology systems and prevent failures in or breaches of such systems; our substantial indebtedness; our ability to raise debt and equity capital; fluctuations in fixed and floating interest rates; our ability to maintain positive relationships with our network of third-party transportation providers; our ability to attract and retain qualified drivers; labor matters, including our ability to manage our subcontractors, and risks associated with labor disputes at our customers and efforts by labor organizations to organize our employees; litigation, including litigation related to alleged misclassification of independent contractors and securities class actions; risks associated with our self-insured claims; risks associated with defined benefit plans for our current and former employees; and governmental regulation, including trade compliance laws, as well as changes in international trade policies and tax regimes; governmental or political actions, including the United Kingdom’s exit from the European Union; and competition and pricing pressures.
All forward-looking statements set forth in this document are qualified by these cautionary statements and there can be no assurance that the actual results or developments anticipated by us will be realized or, even if substantially realized, that they will have the expected consequences to or effects on us or our business or operations. Forward-looking statements set forth in this document speak only as of the date hereof, and we do not undertake any obligation to update forward-looking statements to reflect subsequent events or circumstances, changes in expectations or the occurrence of unanticipated events, except to the extent required by law.
15
Exhibit 99.2
INVESTOR PRESENTATION MAY 2021 v MAY 2021 Investor Presentation
INVESTOR PRESENTATION MAY 2021 Disclaimers 2 NON - GAAP FINANCIAL MEASURES As required by the rules of the Securities and Exchange Commission ("SEC"), we provide reconciliations of the non - GAAP financial measures contained in this presentation to the most directly comparable measure under GAAP, which are set forth in the financial tables attached to this document . This document contains the following non - GAAP financial measures : adjusted earnings before interest, taxes, depreciation and amortization (“adjusted EBITDA”) and adjusted EBITDA margin for the three - month periods ended March 31 , 2021 and 2020 on a consolidated basis ; adjusted EBITDA and adjusted EBITDA excluding truckload for the twelve - month periods ended December 31 , 2020 , 2019 , 2018 , 2017 , 2016 and 2015 ; free cash flow for the three - month periods ended March 31 , 2021 and 2020 , and the twelve - month periods ended December 31 , 2020 , 2019 , 2018 , 2017 , 2016 and 2015 ; adjusted net income attributable to common shareholders and adjusted earnings per share (basic and diluted) (“adjusted EPS”) for the three - month periods ended March 31 , 2021 and 2020 ; adjusted EBITDA, adjusted operating income and adjusted operating ratio for our North American less - than - truckload business for the three - month periods ended March 31 , 2021 and 2020 and the twelve - month periods ended December 31 , 2020 , 2019 , 2018 , 2017 , 2016 and 2015 ; and net debt and net leverage as of March 31 , 2021 . We believe that the above adjusted financial measures facilitate analysis of our ongoing business operations because they exclude items that may not be reflective of, or are unrelated to, XPO and its business segments' core operating performance, and may assist investors with comparisons to prior periods and assessing trends in our underlying businesses . Other companies may calculate these non - GAAP financial measures differently, and therefore our measures may not be comparable to similarly titled measures of other companies . These non - GAAP financial measures should only be used as supplemental measures of our operating performance . Adjusted EBITDA, adjusted net income attributable to common shareholders and adjusted EPS include adjustments for transaction and integration, as well as restructuring costs and other adjustments as set forth in the attached tables . Transaction and integration adjustments are generally incremental costs that result from an actual or planned acquisition, divestiture or spin - off and may include transaction costs, consulting fees, retention awards, and internal salaries and wages (to the extent the individuals are assigned full - time to integration and transformation activities) and certain costs related to integrating and converging IT systems . Restructuring costs primarily relate to severance costs associated with business optimization initiatives . Management uses these non - GAAP financial measures in making financial, operating and planning decisions and evaluating XPO's and each business segment's ongoing performance . We believe that free cash flow is an important measure of our ability to repay maturing debt or fund other uses of capital that we believe will enhance stockholder value . We calculate free cash flow as net cash provided by operating activities, less payment for purchases of property and equipment plus proceeds from sale of property and equipment . We believe that adjusted EBITDA, adjusted EBITDA margin and adjusted EBITDA excluding truckload improve comparability from period to period by removing the impact of our capital structure (interest and financing expenses), asset base (depreciation and amortization), tax impacts and other adjustments as set out in the attached tables that management has determined are not reflective of core operating activities and thereby assist investors with assessing trends in our underlying businesses . We believe that adjusted net income attributable to common shareholders and adjusted EPS improve the comparability of our operating results from period to period by removing the impact of certain costs and gains that management has determined are not reflective of our core operating activities, including amortization of acquisition - related intangible assets . We believe that adjusted operating income and adjusted operating ratio for our North American less - than - truckload business improve the comparability of our operating results from period to period by ( i ) removing the impact of certain transaction and integration and restructuring costs, as well as amortization expenses ; and (ii) including the impact of pension income incurred in the reporting period as set out in the attached tables . We believe that net debt and net leverage are important measures of our overall liquidity position and are calculated by removing cash and cash equivalents from our reported total debt and reporting net debt as a ratio of our last twelve - month reported adjusted EBITDA . With respect to our full year 2021 financial targets for adjusted EBITDA, adjusted diluted EPS and free cash flow, a reconciliation of these non - GAAP measures to the corresponding GAAP measures is not available without unreasonable effort due to the variability and complexity of the reconciling items described above that we exclude from these non - GAAP target measures . The variability of these items may have a significant impact on our future GAAP financial results and, as a result, we are unable to prepare the forward - looking statement of income and statement of cash flows prepared in accordance with GAAP that would be required to produce such a reconciliation . FORWARD - LOOKING STATEMENTS This document includes forward - looking statements within the meaning of Section 27 A of the Securities Act of 1933 , as amended, and Section 21 E of the Securities Exchange Act of 1934 , as amended, including our future growth prospects for EBITDA in our North American less - than - truckload business, our company's potential profit growth opportunity, our company’s full year 2021 financial targets for adjusted EBITDA, depreciation and amortization (excluding acquisition - related amortization expense), interest expense, effective tax rate, adjusted diluted EPS, gross capital expenditures, net capital expenditures and free cash flow, as well as our company’s planned spin - off of its logistics segment and its plan to pursue an investment - grade credit rating . All statements other than statements of historical fact are, or may be deemed to be, forward - looking statements . In some cases, forward - looking statements can be identified by the use of forward - looking terms such as “anticipate,” “estimate,” “believe,” “continue,” “could,” “intend,” “may,” “plan,” “potential,” “predict,” “should,” “will,” “expect,” “objective,” “projection,” “forecast,” “goal,” “guidance,” “outlook,” “effort,” “target,” “trajectory” or the negative of these terms or other comparable terms . However, the absence of these words does not mean that the statements are not forward - looking . These forward - looking statements are based on certain assumptions and analyses made by us in light of our experience and our perception of historical trends, current conditions and expected future developments, as well as other factors we believe are appropriate in the circumstances . These forward - looking statements are subject to known and unknown risks, uncertainties and assumptions that may cause actual results, levels of activity, performance or achievements to be materially different from any future results, levels of activity, performance or achievements expressed or implied by such forward - looking statements . Factors that might cause or contribute to a material difference include the risks discussed in our filings with the SEC and the following : economic conditions generally ; the severity, magnitude, duration and aftereffects of the COVID - 19 pandemic and government responses to the COVID - 19 pandemic ; our ability to align our investments in capital assets, including equipment, service centers and warehouses, to our customers' demands ; our ability to implement our cost and revenue initiatives ; our ability to successfully integrate and realize anticipated synergies, cost savings and profit improvement opportunities with respect to acquired companies ; matters related to our intellectual property rights ; fluctuations in currency exchange rates ; fuel price and fuel surcharge changes ; natural disasters, terrorist attacks or similar incidents ; risks and uncertainties regarding the potential timing and expected benefits of the proposed spin - off of our logistics segment, including final approval for the proposed spin - off and the risk that the spin - off may not be completed on the terms or timeline currently contemplated, if at all ; the impact of the proposed spin - off on the size and business diversity of our company ; the ability of the proposed spin - off to qualify for tax - free treatment for U . S . federal income tax purposes ; our ability to develop and implement suitable information technology systems and prevent failures in or breaches of such systems ; our substantial indebtedness ; our ability to raise debt and equity capital ; fluctuations in fixed and floating interest rates ; our ability to maintain positive relationships with our network of third - party transportation providers ; our ability to attract and retain qualified drivers ; labor matters, including our ability to manage our subcontractors, and risks associated with labor disputes at our customers and efforts by labor organizations to organize our employees ; litigation, including litigation related to alleged misclassification of independent contractors and securities class actions ; risks associated with our self - insured claims ; risks associated with defined benefit plans for our current and former employees ; and governmental regulation, including trade compliance laws, as well as changes in international trade policies and tax regimes ; governmental or political actions, including the United Kingdom's exit from the European Union ; and competition and pricing pressures . All forward - looking statements set forth in this deck are qualified by these cautionary statements and there can be no assurance that the actual results or developments anticipated by us will be realized or, even if substantially realized, that they will have the expected consequences to or effects on us or our business or operations . Forward - looking statements set forth in this deck speak only as of the date hereof, and we do not undertake any obligation to update forward - looking statements to reflect subsequent events or circumstances, changes in expectations or the occurrence of unanticipated events, except to the extent required by law .

INVESTOR PRESENTATION MAY 2021 Table of contents 3 KEY FACTORS DRIVING GROWTH AND RETURNS 4 BUSINESS OVERVIEW 5 Q1 2021 KEY FINANCIAL RESULTS 8 GXO: LOGISTICS 14 XPO: TRANSPORTATION 23 SUPPLEMENTAL MATERIALS 39 APPENDIX 53

INVESTOR PRESENTATION MAY 2021 Key factors driving growth and returns 4 Scale positions in large, growing markets ▪ Core markets are large, fragmented and growing, providing multiple opportunities to grow the business organically and through M&A ▪ Market - leading positions across business units, with each strategically benefiting from technology, scale and long - tenured customer relationships Poised to benefit from secular macro tailwinds across all major service lines ▪ Accelerating consumer shift to e - commerce is driving significant gains in both the logistics and transportation businesses ▪ Industrial recovery is turbocharging demand, particularly in our North American LTL business Accelerating momentum in the less - than - truckload business ▪ Largest operating margin improvement in the LTL industry over the last five years; now with the second highest margin in the industry ▪ LTL operational improvements and technology initiatives are expected to drive further growth and margin expansion Best - in - class brokerage platform with digital advantage ▪ Record - setting recent performance, as business continues to execute in a white - hot market; asset - light model converts top - line growth into free cash flow and high ROIC ▪ Proprietary digital brokerage technology is a key strategic advantage in a fast - growing market where shippers are increasingly outsourcing truckload shipments to brokers Major growth drivers are fueling logistics business ▪ COVID has accelerated the growth in e - commerce and the shift to outsourced logistics; both increase demand for our logistics services ▪ Warehouses are becoming increasingly automated for efficiency, speed and safety; we are well - positioned to capitalize on our first - mover advantage as a technology leader in the space Experienced management team with a track record of delivering results ▪ Deep bench of experienced leaders in each business line, with a long history of generating growth, expanding margins and delivering value to shareholders ▪ XPO has beaten consensus estimates for four quarters running, with substantial beats in Q1 2021 and all of H2 2020

INVESTOR PRESENTATION MAY 2021 Business overview
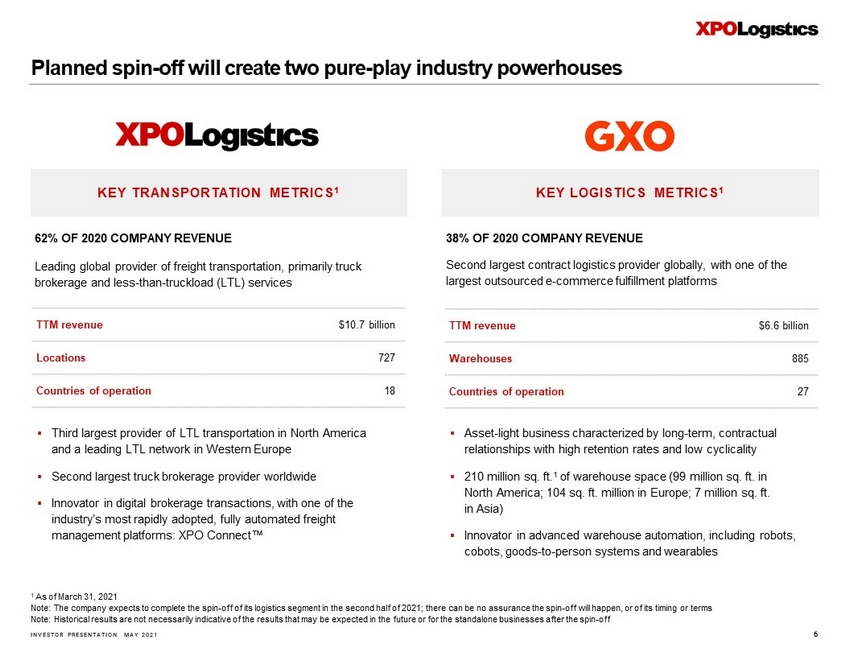
INVESTOR PRESENTATION MAY 2021 Planned spin - off will create two pure - play industry powerhouses 6 Second largest contract logistics provider globally, with one of the largest outsourced e - commerce fulfillment platforms Leading global provider of freight transportation, primarily truck brokerage and less - than - truckload (LTL) services KEY LOGISTICS METRICS 1 KEY TRANSPORTATION METRICS 1 1 As of March 31, 2021 Note: The company expects to complete the spin - off of its logistics segment in the second half of 2021; there can be no assuranc e the spin - off will happen, or of its timing or terms Note: Historical results are not necessarily indicative of the results that may be expected in the future or for the standalo ne businesses after the spin - off ▪ Third largest provider of LTL transportation in North America and a leading LTL network in Western Europe ▪ Second largest truck brokerage provider worldwide ▪ Innovator in digital brokerage transactions, with one of the industry’s most rapidly adopted, fully automated freight management platforms: XPO Connect Œ ▪ Asset - light business characterized by long - term, contractual relationships with high retention rates and low cyclicality ▪ 210 million sq. ft. 1 of warehouse space (99 million sq. ft. in North America; 104 sq. ft. million in Europe; 7 million sq. ft. in Asia) ▪ Innovator in advanced warehouse automation, including robots, cobots , goods - to - person systems and wearables 62% OF 2020 COMPANY REVENUE 38% OF 2020 COMPANY REVENUE TTM revenue $10.7 billion Locations 727 Countries of operation 18 TTM revenue $6.6 billion Warehouses 885 Countries of operation 27
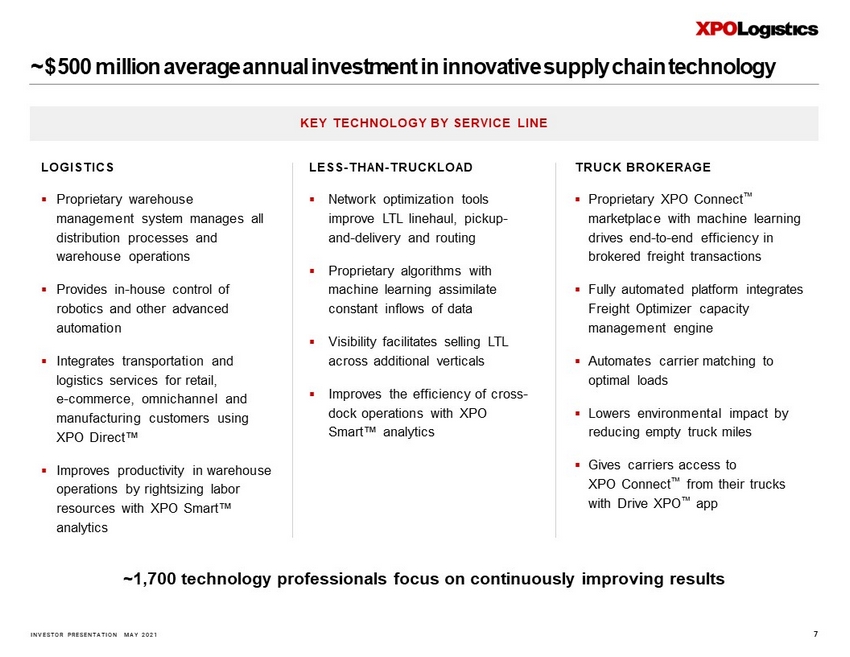
INVESTOR PRESENTATION MAY 2021 ~$ 500 million average annual investment in innovative supply chain technology 7 LOGISTICS ▪ Proprietary warehouse management system manages all distribution processes and warehouse operations ▪ Provides in - house control of robotics and other advanced automation ▪ Integrates transportation and logistics services for retail, e - commerce, omnichannel and manufacturing customers using XPO Direct Œ ▪ Improves productivity in warehouse operations by rightsizing labor resources with XPO Smart Œ analytics LESS - THAN - TRUCKLOAD ▪ Network optimization tools improve LTL linehaul, pickup - and - delivery and routing ▪ Proprietary algorithms with machine learning assimilate constant inflows of data ▪ Visibility facilitates selling LTL across additional verticals ▪ Improves the efficiency of cross - dock operations with XPO Smart Œ analytics TRUCK BROKERAGE ▪ Proprietary XPO Connect Œ marketplace with machine learning drives end - to - end efficiency in brokered freight transactions ▪ Fully automated platform integrates Freight Optimizer capacity management engine ▪ Automates carrier matching to optimal loads ▪ Lowers environmental impact by reducing empty truck miles ▪ Gives carriers access to XPO Connect Œ from their trucks with Drive XPO Œ app KEY TECHNOLOGY BY SERVICE LINE ~1,700 technology professionals focus on continuously improving results

INVESTOR PRESENTATION MAY 2021 Q1 2021 key financial results

INVESTOR PRESENTATION MAY 2021 Industry - leading growth in revenue and adjusted EBITDA 9 REVENUE ADJUSTED EBITDA Note: Both charts exclude the impact of the North American truckload unit divested in October 2016 Refer to the “Non - GAAP Financial Measures” section on page 2 and Appendix for related information 7,533 14,188 15,381 17,279 16,648 16,252 0 4,000 8,000 12,000 16,000 20,000 2015 2016 2017 2018 2019 2020 474 1,168 1,367 1,562 1,668 1,393 0 250 500 750 1,000 1,250 1,500 1,750 2,000 2015 2016 2017 2018 2019 2020 2021F 1,825 – 1,875 $ in millions $ in millions
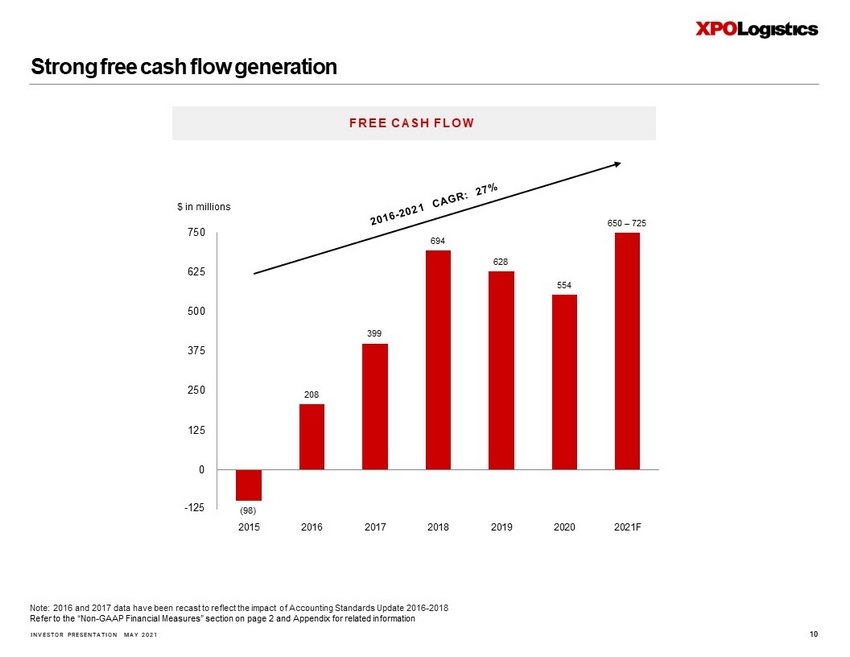
INVESTOR PRESENTATION MAY 2021 Strong free cash flow generation 10 FREE CASH FLOW Note: 2016 and 2017 data have been recast to reflect the impact of Accounting Standards Update 2016 - 2018 Refer to the “Non - GAAP Financial Measures” section on page 2 and Appendix for related information $ in millions (98) 208 399 694 628 554 650 – 725 -125 0 125 250 375 500 625 750 2015 2016 2017 2018 2019 2020 2021F - 125

INVESTOR PRESENTATION MAY 2021 Balance sheet and liquidity as of March 31, 2021 11 NET DEBT 1 $4.6 billion CASH AND CASH EQUIVALENTS $629 million NET LEVERAGE 2 3.1x TOTAL LIQUIDITY $1.7 billion Recent activities ▪ In January, the company redeemed $1.2 billion of 6.5% Senior Notes due 2022 ▪ In March, the company refinanced its $2.0 billion term loan, reducing the interest spread by three - eighths of a point ▪ No significant debt maturities until September 2023 ▪ Substantially all convertible preferred stock converted into common stock in December 2020 1 Calculated as total debt of $5.25 billion less cash and cash equivalents of $629 million 2 Calculated as net debt of $4.6 billion divided by TTM adjusted EBITDA of $1.5 billion Refer to the “Non - GAAP Financial Measures” section on page 2 and Appendix for related information
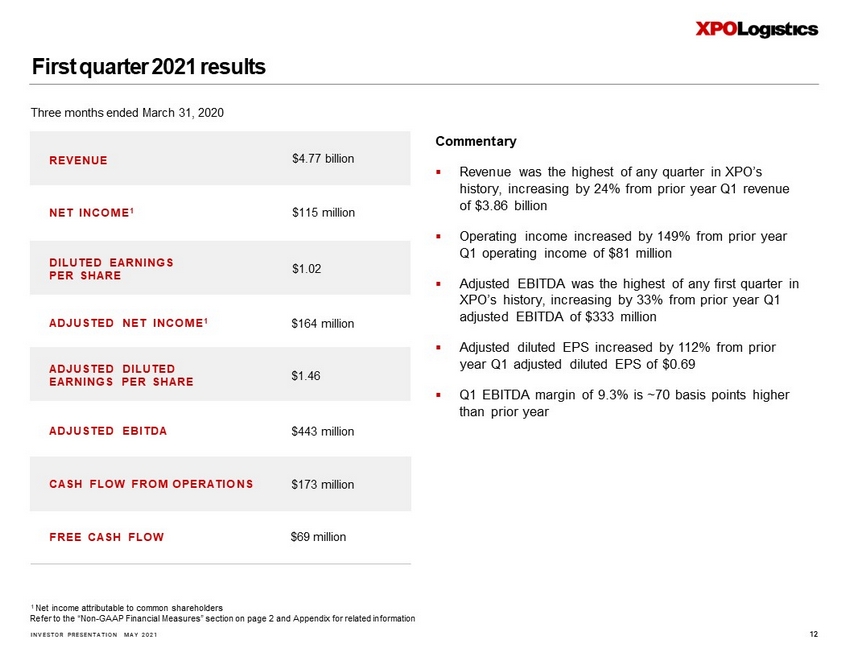
INVESTOR PRESENTATION MAY 2021 First quarter 2021 results 12 REVENUE $4.77 billion NET INCOME 1 $115 million DILUTED EARNINGS PER SHARE $1.02 ADJUSTED NET INCOME 1 $164 million ADJUSTED DILUTED EARNINGS PER SHARE ADJUSTED EBITDA $443 million CASH FLOW FROM OPERATIONS $173 million FREE CASH FLOW $69 million $1.46 Commentary ▪ Revenue was the highest of any quarter in XPO’s history, increasing by 24% from prior year Q1 revenue of $3.86 billion ▪ Operating income increased by 149% from prior year Q1 operating income of $81 million ▪ Adjusted EBITDA was the highest of any first quarter in XPO’s history, increasing by 33% from prior year Q1 adjusted EBITDA of $333 million ▪ Adjusted diluted EPS increased by 112% from prior year Q1 adjusted diluted EPS of $0.69 ▪ Q1 EBITDA margin of 9.3% is ~70 basis points higher than prior year Three months ended March 31, 2020 1 Net income attributable to common shareholders Refer to the “Non - GAAP Financial Measures” section on page 2 and Appendix for related information
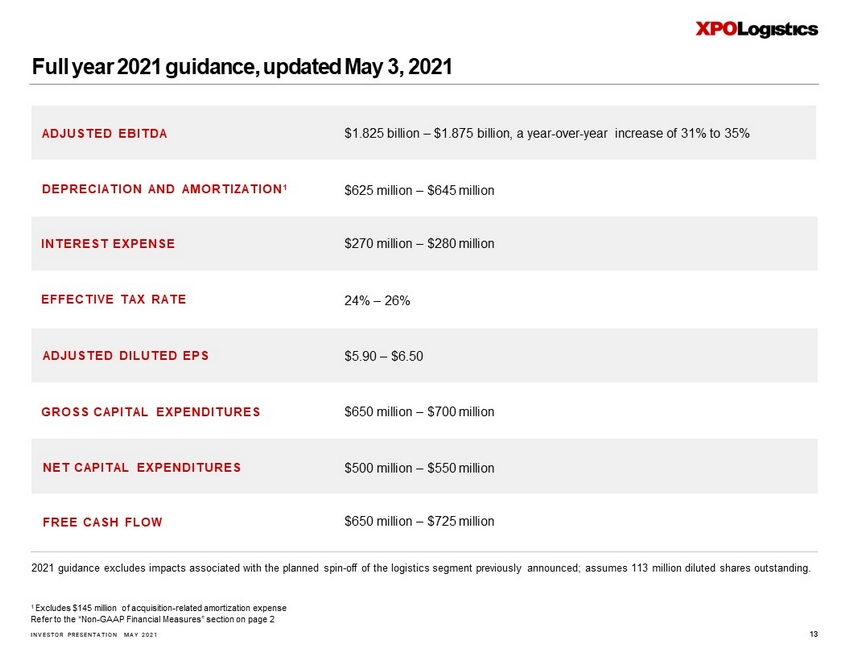
INVESTOR PRESENTATION MAY 2021 2021 guidance excludes impacts associated with the planned spin - off of the logistics segment previously announced; assumes 113 m illion diluted shares outstanding. ADJUSTED EBITDA $1.825 billion – $1.875 billion, a year - over - year increase of 31% to 35% DEPRECIATION AND AMORTIZATION 1 $625 million – $645 million INTEREST EXPENSE $270 million – $280 million EFFECTIVE TAX RATE 24% – 26% GROSS CAPITAL EXPENDITURES $650 million – $700 million ADJUSTED DILUTED EPS $5.90 – $6.50 $650 million – $725 million Full year 2021 guidance, updated May 3, 2021 13 1 Excludes $145 million of acquisition - related amortization expense Refer to the “Non - GAAP Financial Measures” section on page 2 NET CAPITAL EXPENDITURES FREE CASH FLOW $500 million – $550 million
INVESTOR PRESENTATION MAY 2021 GXO: Logistics
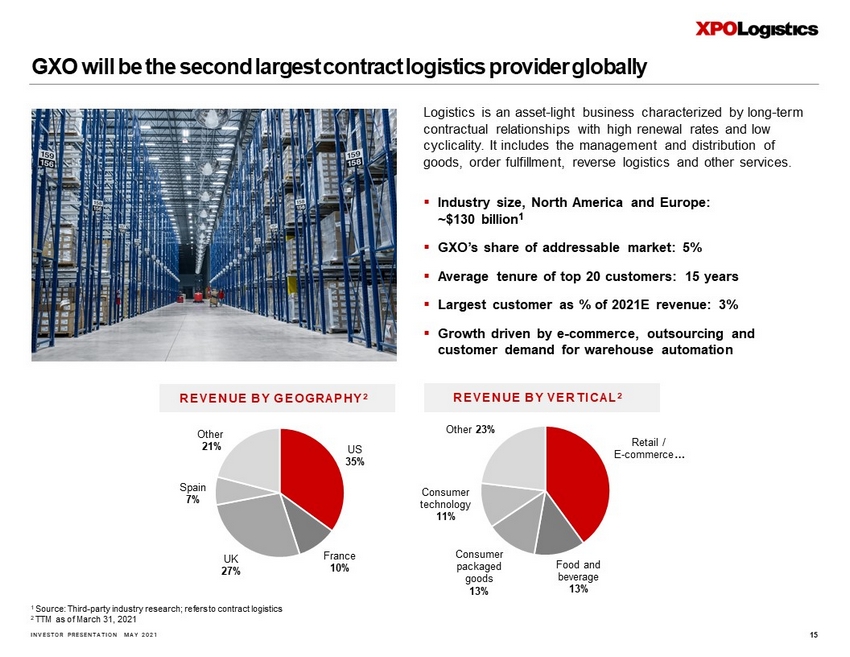
INVESTOR PRESENTATION MAY 2021 US 35% France 10% UK 27% Spain 7% Other 21% Retail / E - commerce … Food and beverage 13% Consumer packaged goods 13% Consumer technology 11% Other 23% GXO will be the second largest contract logistics provider globally Logistics is an asset - light business characterized by long - term contractual relationships with high renewal rates and low cyclicality. It includes the management and distribution of goods, order fulfillment, reverse logistics and other services. ▪ Industry size, North America and Europe: ~ $130 billion 1 ▪ GXO’s share of addressable market: 5% ▪ Average tenure of top 20 customers: 15 years ▪ Largest customer as % of 2021E revenue: 3% ▪ Growth driven by e - commerce, outsourcing and customer demand for warehouse automation REVENUE BY GEOGRAPHY 2 1 Source: Third - party industry research; refers to contract logistics 2 TTM as of March 31, 2021 15 REVENUE BY VERTICAL 2
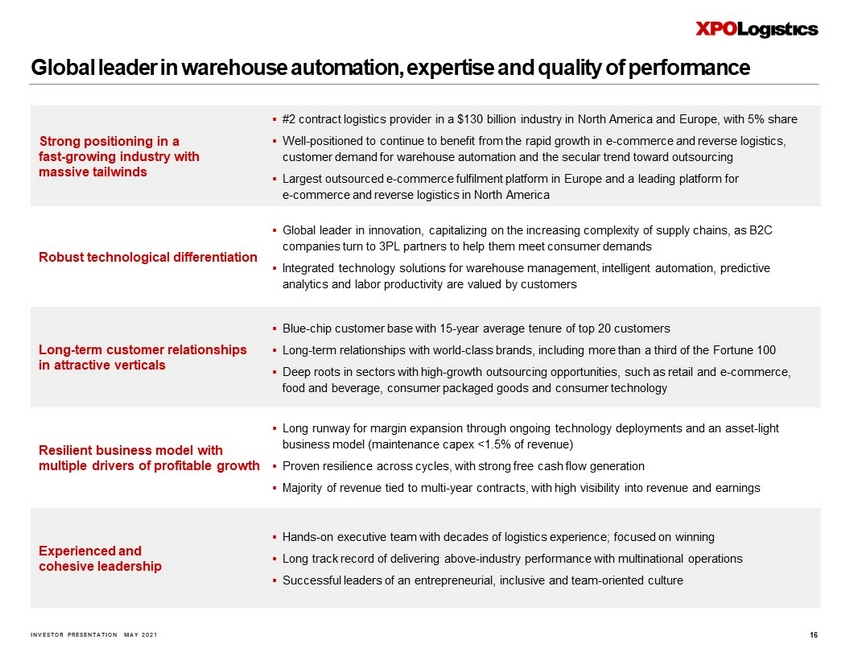
INVESTOR PRESENTATION MAY 2021 Global leader in warehouse automation, expertise and quality of performance 16 Strong positioning in a fast - growing industry with massive tailwinds ▪ #2 contract logistics provider in a $130 billion industry in North America and Europe, with 5% share ▪ Well - positioned to continue to benefit from the rapid growth in e - commerce and reverse logistics, customer demand for warehouse automation and the secular trend toward outsourcing ▪ Largest outsourced e - commerce fulfilment platform in Europe and a leading platform for e - commerce and reverse logistics in North America Robust technological differentiation ▪ Global leader in innovation, capitalizing on the increasing complexity of supply chains, as B2C companies turn to 3PL partners to help them meet consumer demands ▪ Integrated technology solutions for warehouse management, intelligent automation, predictive analytics and labor productivity are valued by customers Long - term customer relationships in attractive verticals ▪ Blue - chip customer base with 15 - year average tenure of top 20 customers ▪ Long - term relationships with world - class brands, including more than a third of the Fortune 100 ▪ Deep roots in sectors with high - growth outsourcing opportunities, such as retail and e - commerce, food and beverage, consumer packaged goods and consumer technology Resilient business model with multiple drivers of profitable growth ▪ Long runway for margin expansion through ongoing technology deployments and an asset - light business model (maintenance capex <1.5% of revenue) ▪ Proven resilience across cycles, with strong free cash flow generation ▪ Majority of revenue tied to multi - year contracts, with high visibility into revenue and earnings Experienced and cohesive leadership ▪ Hands - on executive team with decades of logistics experience; focused on winning ▪ Long track record of delivering above - industry performance with multinational operations ▪ Successful leaders of an entrepreneurial, inclusive and team - oriented culture
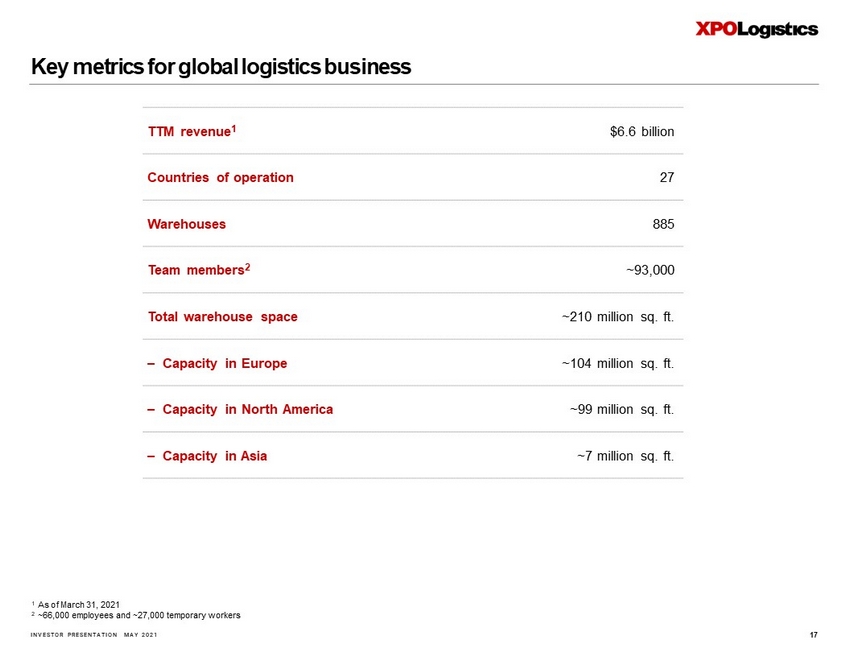
INVESTOR PRESENTATION MAY 2021 TTM revenue 1 $6.6 billion Countries of operation 27 Warehouses 885 Team members 2 ~93,000 Total warehouse space ~ 210 million sq. ft. – Capacity in Europe ~ 104 million sq. ft. – Capacity in North America ~ 99 million sq. ft. – Capacity in Asia ~ 7 million sq. ft. Key metrics for global logistics business 17 1 As of March 31, 2021 2 ~66,000 employees and ~ 27 ,000 temporary workers
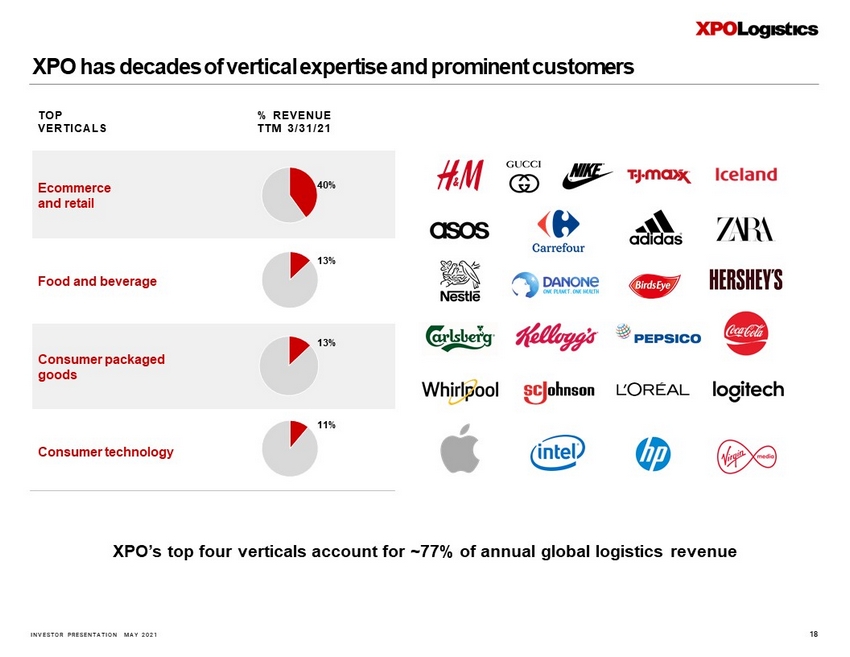
INVESTOR PRESENTATION MAY 2021 XPO has decades of vertical expertise and prominent customers 18 TOP VERTICALS % REVENUE TTM 3/31/21 Ecommerce and retail Food and beverage Consumer packaged goods Consumer technology 11% 13% 13% 40% XPO’s top four verticals account for ~77% of annual global logistics revenue

INVESTOR PRESENTATION MAY 2021 19 Customization positions GXO as a mission - critical partner for customers Differentiated by consistently superior outcomes tailored to customer expectations ▪ Drives significant improvements in labor productivity and throughput ▪ In - house control with warehouse management system facilitates redeployment between projects ▪ Purpose - built solutions optimize warehouse capacity and flexibility ▪ Customizable systems for handling complex product returns solve a fast - growing need for companies faced with burgeoning returns ▪ Full lifecycle management of returned merchandise ▪ Strategic collaboration to help customers achieve ESG goals ▪ C hannel - specific boxing and labeling ▪ Order personalization ▪ Supply chain optimization ▪ Demand forecasting REVERSE LOGISTICS AND AFTERMARKET SUPPORT ADVANCED AUTOMATION AND ROBOTICS HIGH - VALUE - ADD SERVICES
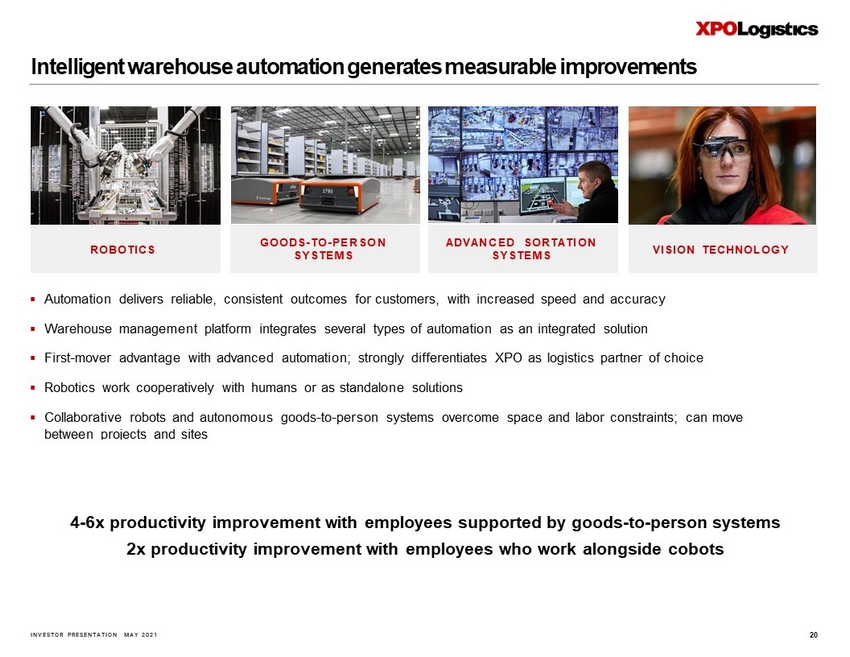
INVESTOR PRESENTATION MAY 2021 20 Intelligent warehouse automation generates measurable improvements ROBOTICS GOODS - TO - PERSON SYSTEMS ADVANCED SORTATION SYSTEMS VISION TECHNOLOGY ▪ Automation delivers reliable, consistent outcomes for customers, with increased speed and accuracy ▪ Warehouse management platform integrates several types of automation as an integrated solution ▪ First - mover advantage with advanced automation; strongly differentiates XPO as logistics partner of choice ▪ Robotics work cooperatively with humans or as standalone solutions ▪ Collaborative robots and autonomous goods - to - person systems overcome space and labor constraints; can move between projects and sites 4 - 6x productivity improvement with employees supported by goods - to - person systems 2x productivity improvement with employees who work alongside cobots
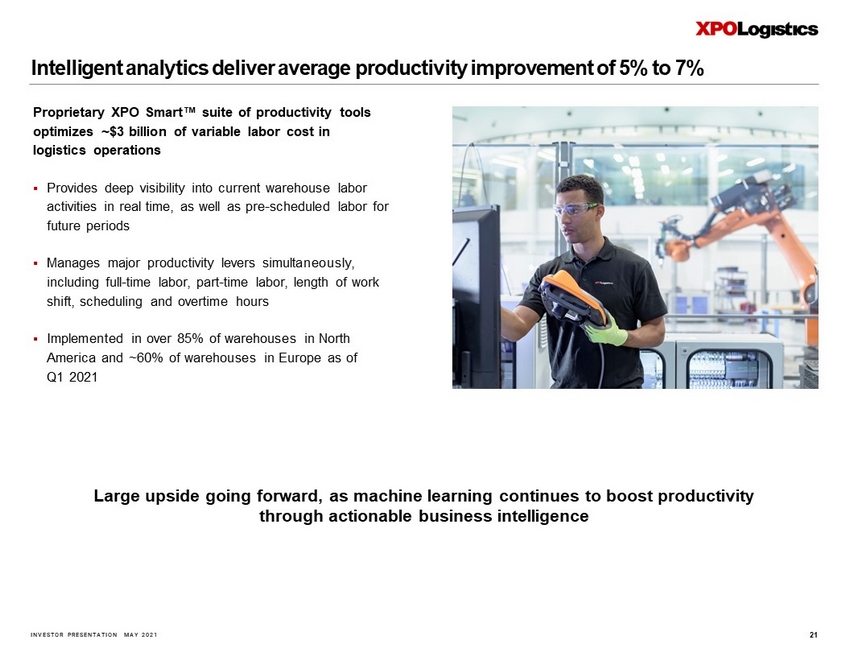
INVESTOR PRESENTATION MAY 2021 21 Proprietary XPO Smart Œ suite of productivity tools optimizes ~$3 billion of variable labor cost in logistics operations ▪ Provides deep visibility into current warehouse labor activities in real time, as well as pre - scheduled labor for future periods ▪ Manages major productivity levers simultaneously, including full - time labor, part - time labor, length of work shift, scheduling and overtime hours ▪ Implemented in over 85% of warehouses in North America and ~60 % of warehouses in Europe as of Q1 2021 Large upside going forward, as machine learning continues to boost productivity through actionable business intelligence Intelligent analytics deliver average productivity improvement of 5% to 7%

INVESTOR PRESENTATION MAY 2021 XPO Direct Œ flexible distribution network in North America 22 ADVANTAGES FOR CUSTOMERS ADVANTAGES FOR XPO ▪ Retailers, e - tailers and manufacturers have access to logistics scale, expertise and technology without adding high - fixed - cost distribution centers ▪ Shortens time from consumer order to delivery, and reduces response time for retail stocking and store replenishment ▪ Cutting - edge technology already in place for ease of doing business at both ends of distribution, including predictive analytics to help plan inventory flows ▪ Customers can reposition inventory within 1 - and 2 - day ground delivery range of ~ 99% of the US population as demand patterns change ▪ Service agility enhances brands XPO Direct Œ is achieving profitability in second full year of operations ▪ Strongly differentiates XPO from other logistics providers in the marketplace ▪ Increases utilization of existing warehouses and other resources ▪ Leverages XPO’s transportation and logistics solutions in combination: – Facilities serve as strategically located stockholding sites and cross docks that can be utilized by multiple customers at the same time – Transportation needs are supported by the company’s brokered, contracted and owned capacity XPO Direct Œ is a national distribution solution that gives customers fluid fulfillment with more flexibility than traditional distribution models, and at lower cost: ▪ Reduces customers’ fixed costs and large capital investments by sharing warehouses, logistics processes, labor and technology with other XPO customers ▪ Reduces goods - in - transit time by repositioning inventory close to target populations as demand patterns change

INVESTOR PRESENTATION MAY 2021 XPO: Transportation
INVESTOR PRESENTATION MAY 2021 Less - than - truckload (LTL)
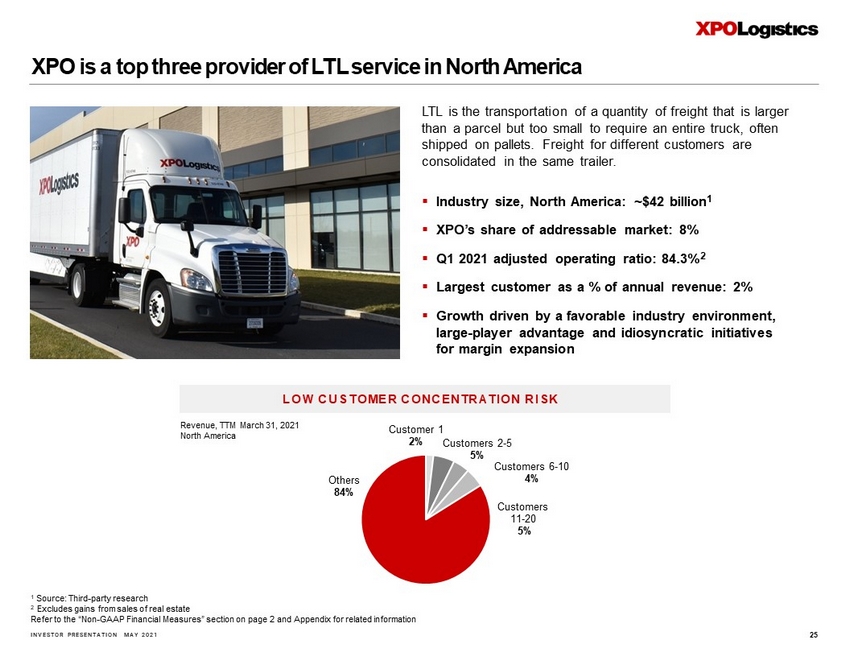
INVESTOR PRESENTATION MAY 2021 XPO is a top three provider of LTL service in North America 25 LTL is the transportation of a quantity of freight that is larger than a parcel but too small to require an entire truck, often shipped on pallets. Freight for different customers are consolidated in the same trailer. ▪ Industry size, North America: ~ $42 billion 1 ▪ XPO’s share of addressable market: 8% ▪ Q1 2021 adjusted operating ratio: 84.3% 2 ▪ Largest customer as a % of annual revenue: 2% ▪ Growth driven by a favorable industry environment, large - player advantage and idiosyncratic initiatives for margin expansion LOW CUSTOMER CONCENTRATION RISK Customer 1 2% Customers 2 - 5 5% Customers 6 - 10 4% Customers 11 - 20 5% Others 84% 1 Source: Third - party research 2 Excludes gains from sales of real estate Refer to the “Non - GAAP Financial Measures” section on page 2 and Appendix for related information Revenue, TTM March 31, 2021 North America
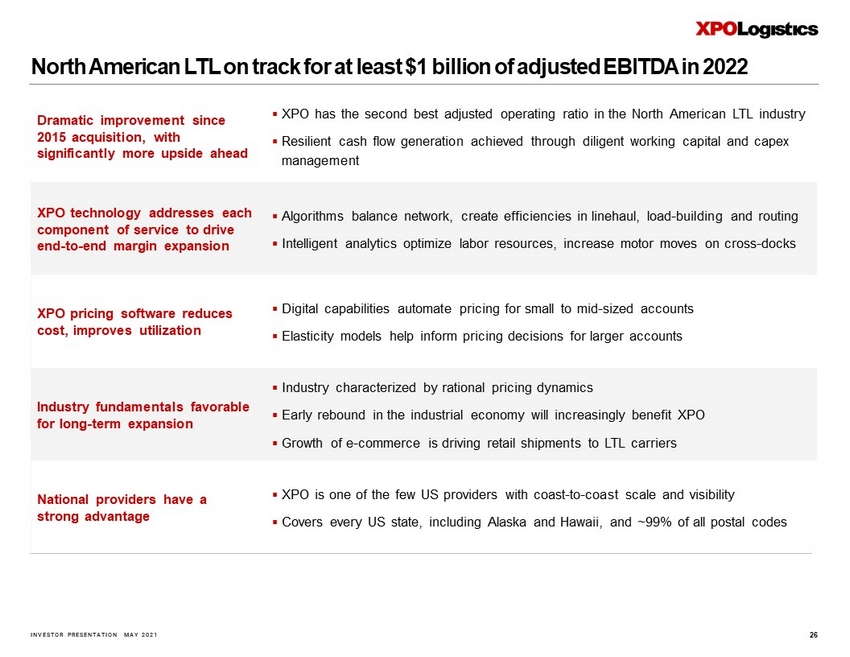
INVESTOR PRESENTATION MAY 2021 26 Dramatic improvement since 2015 acquisition, with significantly more upside ahead ▪ XPO has the second best adjusted operating ratio in the North American LTL industry ▪ Resilient cash flow generation achieved through diligent working capital and capex management XPO technology addresses each component of service to drive end - to - end margin expansion ▪ Algorithms balance network, create efficiencies in linehaul, load - building and routing ▪ Intelligent analytics optimize labor resources, increase motor moves on cross - docks XPO pricing software reduces cost, improves utilization ▪ Digital capabilities automate pricing for small to mid - sized accounts ▪ Elasticity models help inform pricing decisions for larger accounts Industry fundamentals favorable for long - term expansion ▪ Industry characterized by rational pricing dynamics ▪ Early rebound in the industrial economy will increasingly benefit XPO ▪ Growth of e - commerce is driving retail shipments to LTL carriers National providers have a strong advantage ▪ XPO is one of the few US providers with coast - to - coast scale and visibility ▪ Covers every US state, including Alaska and Hawaii, and ~ 99% of all postal codes North American LTL on track for at least $1 billion of adjusted EBITDA in 2022

INVESTOR PRESENTATION MAY 2021 TTM revenue 1 $3.6 billion Locations 291 Team members 2 ~20,900 Number of tractors / trailers ~ 7,900 / 25,000 Shipments per year 3 ~12.4 million Key metrics for XPO’s North American LTL business 27 1 As of March 31, 2021, North America only 2 ~20,700 employees and ~ 200 temporary workers 3 FY 2020 Over 30 years of experience and deep relationships with domestic and cross - border customers

INVESTOR PRESENTATION MAY 2021 +960 basis point improvement in operating margin 2015 – 2020, with more to come Company - specific initiatives are optimizing every component of LTL service 28 North American LTL’s dramatic margin expansion is being driven by technology implementations and operational excellence. ▪ Powerful software developed by XPO specifically for LTL ▪ Dynamic routing optimizes pickups and deliveries, with real - time digital visibility ▪ Automated load - building tools improve trailer utilization for best use of assets and drivers ▪ Data - driven pricing tools lower cost to serve smaller accounts and optimize pricing for larger accounts 1 Adjusted operating margin is the inverse of adjusted operating ratio Refer to the “Non - GAAP Financial Measures” section on page 2 and Appendix for related information INDUSTRY - BEST IMPROVEMENT IN ADJUSTED OPERATING MARGIN 1 7% 16% 2015 2020

INVESTOR PRESENTATION MAY 2021 XPO Smart Œ intelligent productivity tools optimize LTL variable labor spend 29 Proprietary technology uses machine learning to become continually smarter at site - specific optimization ▪ Analyzes all major productivity levers simultaneously, giving managers the data to make the best overall decisions about full - time labor, part - time labor, length of work shift, scheduling and overtime hours ▪ Drives more motor moves per hour on LTL cross - docks, with high engagement of dockworkers and drivers ▪ Provides visibility into cross - dock labor activity in real time, as well as pre - scheduled labor for future periods ▪ Helps managers understand the future impact of operational decisions through site - specific modeling ▪ Takes turnover and training time into account when mapping productivity Implemented in 100% of North American LTL network, with significant productivity enhancements expected when fully utilized XPO IMAGE – IINSIDE OF LTL TRAILER
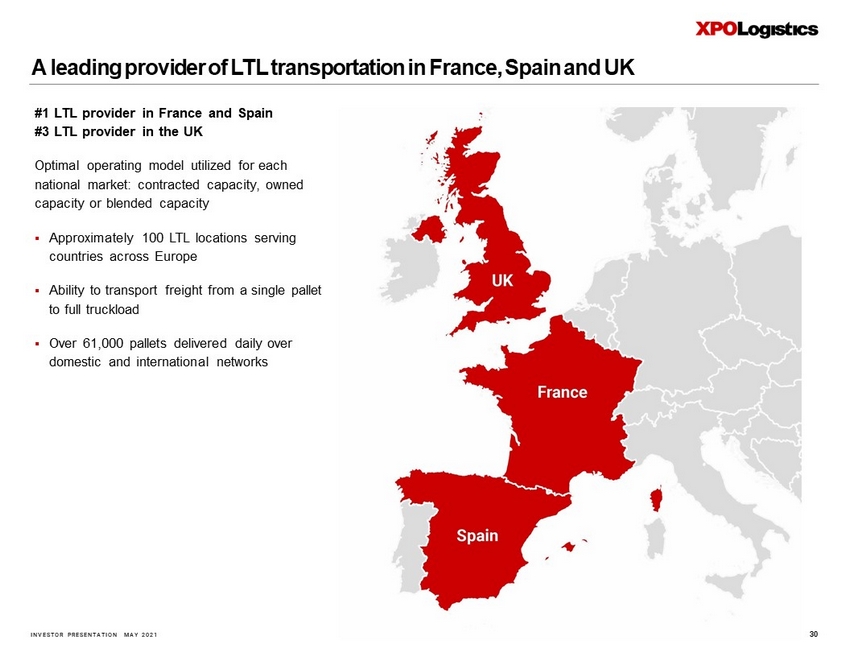
INVESTOR PRESENTATION MAY 2021 A leading provider of LTL transportation in France, Spain and UK 30 #1 LTL provider in France and Spain #3 LTL provider in the UK Optimal operating model utilized for each national market: contracted capacity, owned capacity or blended capacity ▪ Approximately 100 LTL locations serving countries across Europe ▪ Ability to transport freight from a single pallet to full truckload ▪ Over 61,000 pallets delivered daily over domestic and international networks

INVESTOR PRESENTATION MAY 2021 Truck brokerage
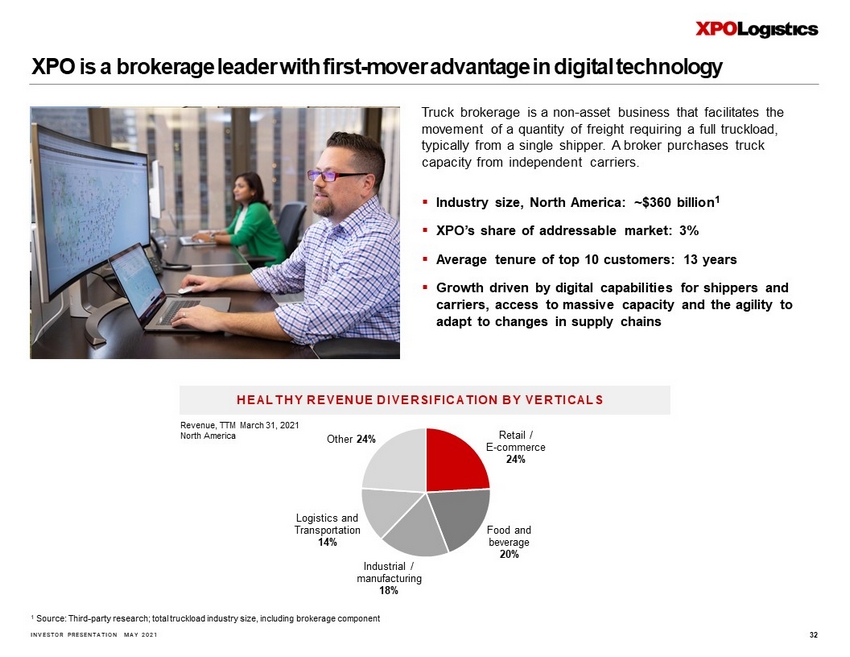
INVESTOR PRESENTATION MAY 2021 Retail / E - commerce 24% Food and beverage 20% Industrial / manufacturing 18% Logistics and Transportation 14% Other 24% XPO is a brokerage leader with first - mover advantage in digital technology 32 Truck brokerage is a non - asset business that facilitates the movement of a quantity of freight requiring a full truckload, typically from a single shipper. A broker purchases truck capacity from independent carriers. ▪ Industry size, North America: ~ $360 billion 1 ▪ XPO’s share of addressable market: 3% ▪ Average tenure of top 10 customers: 13 years ▪ Growth driven by digital capabilities for shippers and carriers, access to massive capacity and the agility to adapt to changes in supply chains HEALTHY REVENUE DIVERSIFICATION BY VERTICALS 1 Source: Third - party research; total truckload industry size, including brokerage component Revenue, TTM March 31, 2021 North America
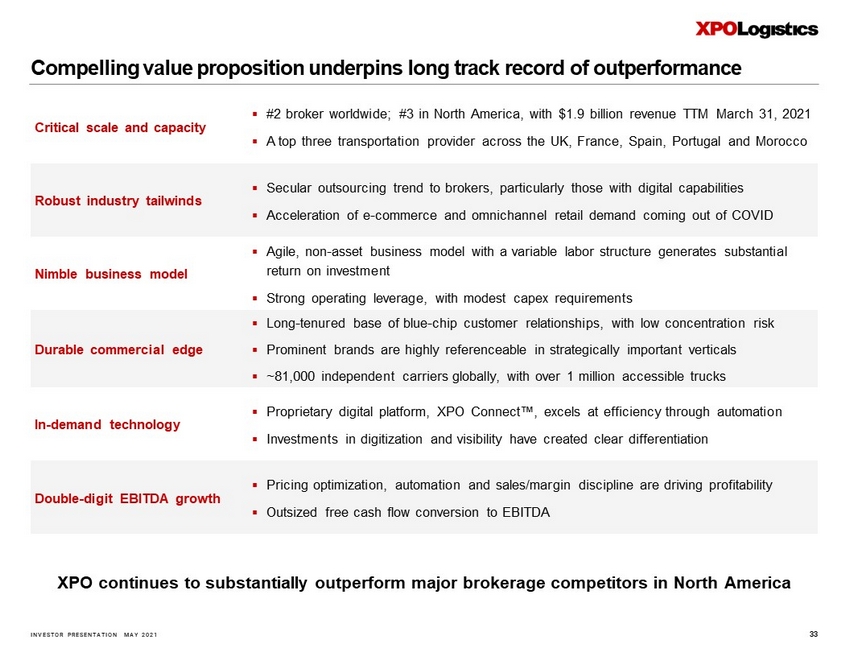
INVESTOR PRESENTATION MAY 2021 Compelling value proposition underpins long track record of outperformance 33 Critical scale and capacity ▪ #2 broker worldwide; #3 in North America, with $1.9 billion revenue TTM March 31, 2021 ▪ A top three transportation provider across the UK, France, Spain, Portugal and Morocco Robust industry tailwinds ▪ Secular outsourcing trend to brokers, particularly those with digital capabilities ▪ Acceleration of e - commerce and omnichannel retail demand coming out of COVID Nimble business model ▪ Agile, non - asset business model with a variable labor structure generates substantial return on investment ▪ Strong operating leverage, with modest capex requirements Durable commercial edge ▪ Long - tenured base of blue - chip customer relationships, with low concentration risk ▪ Prominent brands are highly referenceable in strategically important verticals ▪ ~81,000 independent carriers globally, with over 1 million accessible trucks In - demand technology ▪ Proprietary digital platform, XPO Connect Œ , excels at efficiency through automation ▪ Investments in digitization and visibility have created clear differentiation Double - digit EBITDA growth ▪ Pricing optimization, automation and sales/margin discipline are driving profitability ▪ Outsized free cash flow conversion to EBITDA XPO continues to substantially outperform major brokerage competitors in North America
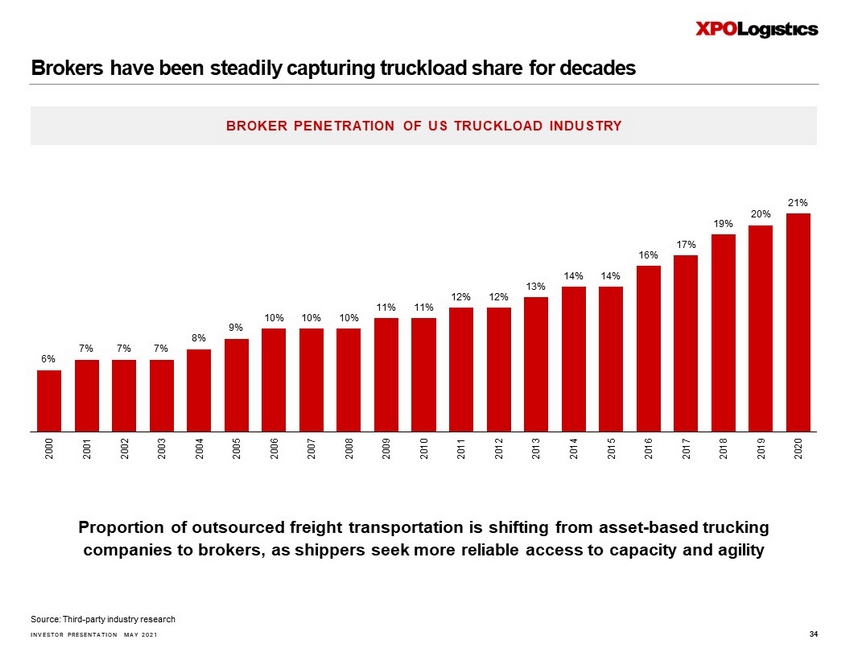
INVESTOR PRESENTATION MAY 2021 Proportion of outsourced freight transportation is shifting from asset - based trucking companies to brokers, as shippers seek more reliable access to capacity and agility 6% 7% 7% 7% 8% 9% 10% 10% 10% 11% 11% 12% 12% 13% 14% 14% 16% 17% 19% 20% 21% 2000 2001 2002 2003 2004 2005 2006 2007 2008 2009 2010 2011 2012 2013 2014 2015 2016 2017 2018 2019 2020 BROKER PENETRATION OF US TRUCKLOAD INDUSTRY Source: Third - party industry research Brokers have been steadily capturing truckload share for decades 34
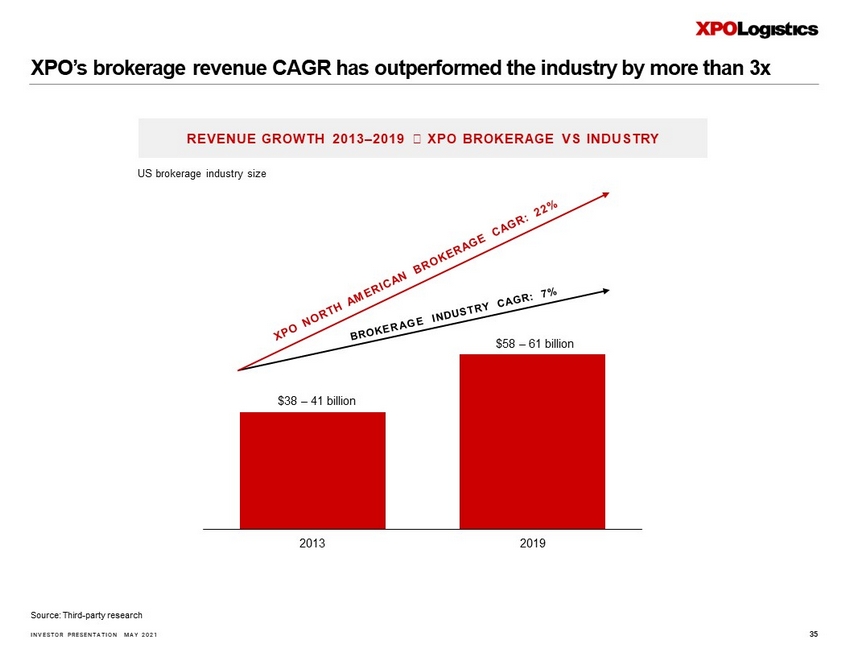
INVESTOR PRESENTATION MAY 2021 REVENUE GROWTH 2013 – 2019 ⏤ XPO BROKERAGE VS INDUSTRY XPO’s brokerage revenue CAGR has outperformed the industry by more than 3x 35 US brokerage industry size $38 – 41 billion $58 – 61 billion 2013 2019 Source: Third - party research
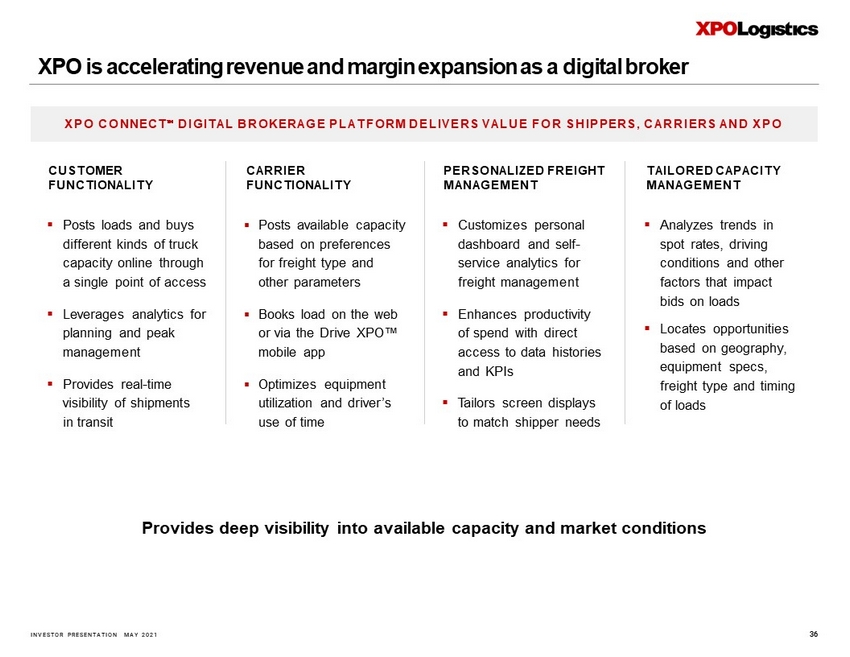
INVESTOR PRESENTATION MAY 2021 XPO CONNECT 䉼 DIGITAL BROKERAGE PLATFORM DELIVERS VALUE FOR SHIPPERS, CARRIER S AND XPO CUSTOMER FUNCTIONALITY CARRIER FUNCTIONALITY PERSONALIZED FREIGHT MANAGEMENT TAILORED CAPACITY MANAGEMENT ▪ Posts loads and buys different kinds of truck capacity online through a single point of access ▪ Leverages analytics for planning and peak management ▪ Provides real - time visibility of shipments in transit ▪ Posts available capacity based on preferences for freight type and other parameters ▪ Books load on the web or via the Drive XPO Œ mobile app ▪ Optimizes equipment utilization and driver’s use of time ▪ Customizes personal dashboard and self - service analytics for freight management ▪ Enhances productivity of spend with direct access to data histories and KPIs ▪ Tailors screen displays to match shipper needs ▪ Analyzes trends in spot rates, driving conditions and other factors that impact bids on loads ▪ Locates opportunities based on geography, equipment specs, freight type and timing of loads XPO is accelerating revenue and margin expansion as a digital broker 36 Provides deep visibility into available capacity and market conditions
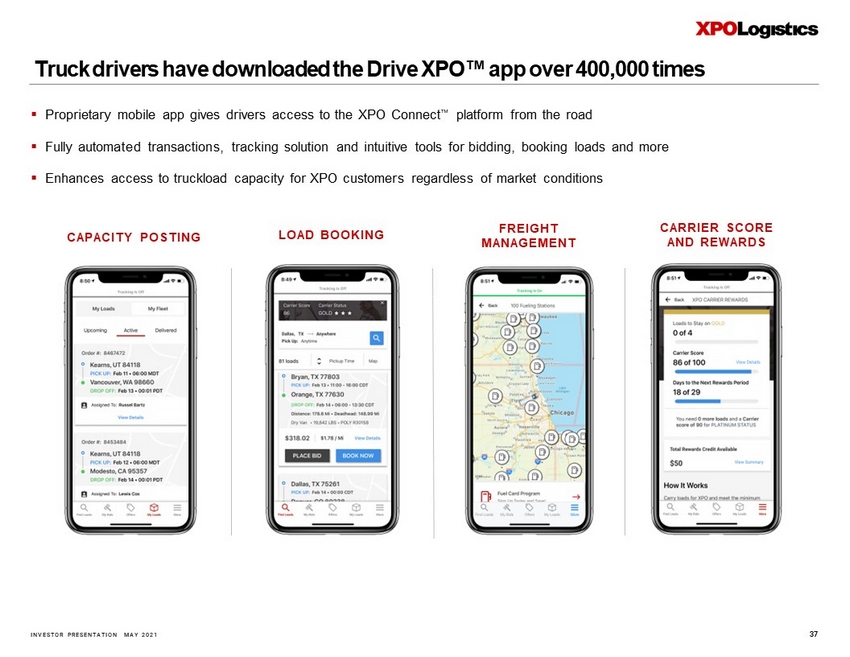
INVESTOR PRESENTATION MAY 2021 ▪ Proprietary mobile app gives drivers access to the XPO Connect Ʀ platform from the road ▪ Fully automated transactions, tracking solution and intuitive tools for bidding, booking loads and more ▪ Enhances access to truckload capacity for XPO customers regardless of market conditions FREIGHT MANAGEMENT CARRIER SCORE AND REWARDS CAPACITY POSTING LOAD BOOKING Truck drivers have downloaded the Drive XPO Œ app over 400,000 times 37
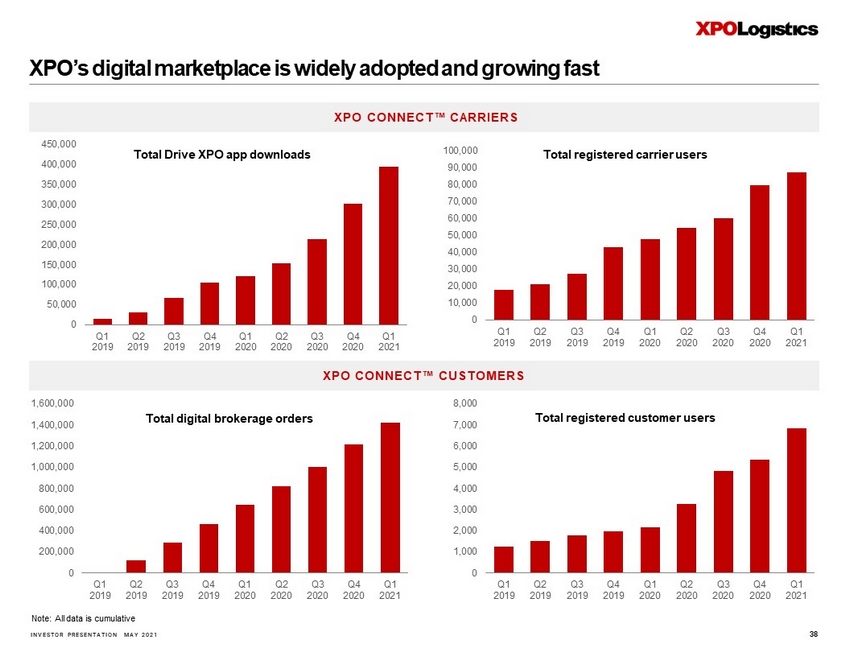
INVESTOR PRESENTATION MAY 2021 Total Drive XPO app downloads Total registered carrier users Total registered customer users XPO CONNECT Œ CARRIERS Total digital brokerage orders Note: All data is cumulative XPO CONNECT Œ CUSTOMERS 0 50,000 100,000 150,000 200,000 250,000 300,000 350,000 400,000 450,000 Q1 2019 Q2 2019 Q3 2019 Q4 2019 Q1 2020 Q2 2020 Q3 2020 Q4 2020 Q1 2021 0 10,000 20,000 30,000 40,000 50,000 60,000 70,000 80,000 90,000 100,000 Q1 2019 Q2 2019 Q3 2019 Q4 2019 Q1 2020 Q2 2020 Q3 2020 Q4 2020 Q1 2021 0 1,000 2,000 3,000 4,000 5,000 6,000 7,000 8,000 Q1 2019 Q2 2019 Q3 2019 Q4 2019 Q1 2020 Q2 2020 Q3 2020 Q4 2020 Q1 2021 0 200,000 400,000 600,000 800,000 1,000,000 1,200,000 1,400,000 1,600,000 Q1 2019 Q2 2019 Q3 2019 Q4 2019 Q1 2020 Q2 2020 Q3 2020 Q4 2020 Q1 2021 XPO’s digital marketplace is widely adopted and growing fast 38
INVESTOR PRESENTATION MAY 2021 Supplemental materials
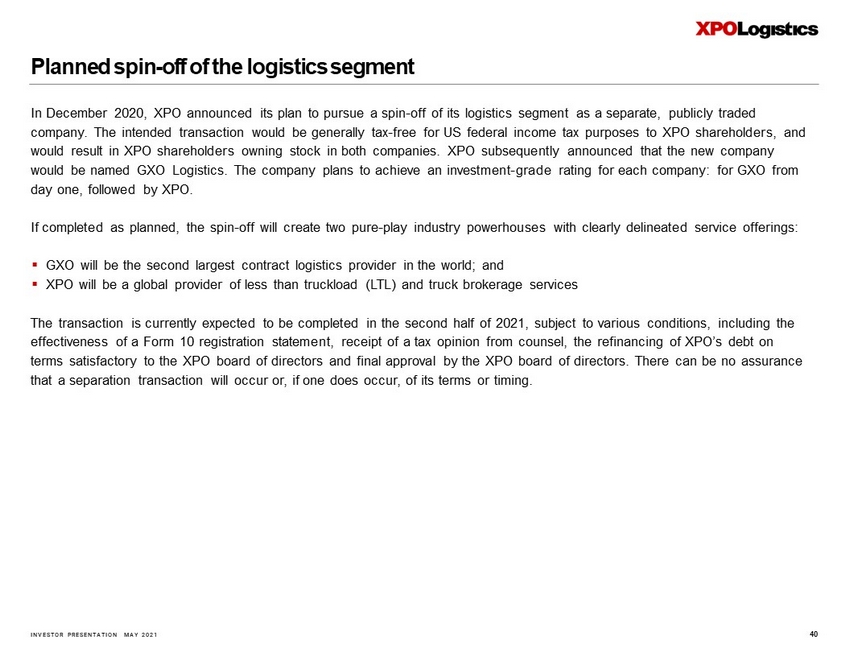
INVESTOR PRESENTATION MAY 2021 40 Planned spin - off of the logistics segment In December 2020, XPO announced its plan to pursue a spin - off of its logistics segment as a separate, publicly traded company. The intended transaction would be generally tax - free for US federal income tax purposes to XPO shareholders, and would result in XPO shareholders owning stock in both companies. XPO subsequently announced that the new company would be named GXO Logistics. The company plans to achieve an investment - grade rating for each company: for GXO from day one, followed by XPO. If completed as planned, the spin - off will create two pure - play industry powerhouses with clearly delineated service offerings: ▪ GXO will be the second largest contract logistics provider in the world; and ▪ XPO will be a global provider of less than truckload (LTL) and truck brokerage services The transaction is currently expected to be completed in the second half of 2021, subject to various conditions, including th e effectiveness of a Form 10 registration statement, receipt of a tax opinion from counsel, the refinancing of XPO’s debt on terms satisfactory to the XPO board of directors and final approval by the XPO board of directors. There can be no assurance that a separation transaction will occur or, if one does occur, of its terms or timing.
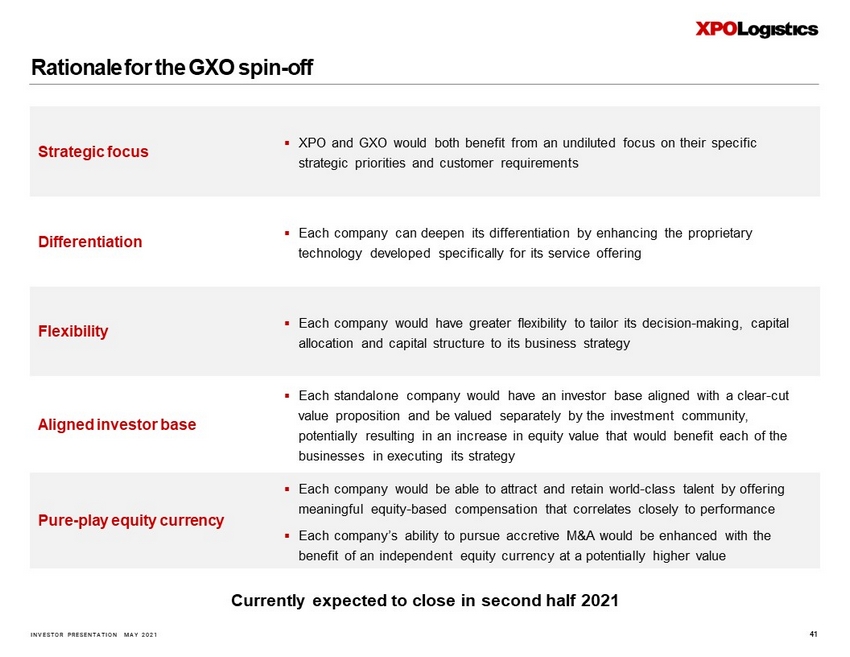
INVESTOR PRESENTATION MAY 2021 Rationale for the GXO spin - off 41 Strategic focus ▪ XPO and GXO would both benefit from an undiluted focus on their specific strategic priorities and customer requirements Differentiation ▪ Each company can deepen its differentiation by enhancing the proprietary technology developed specifically for its service offering Flexibility ▪ Each company would have greater flexibility to tailor its decision - making, capital allocation and capital structure to its business strategy Aligned investor base ▪ Each standalone company would have an investor base aligned with a clear - cut value proposition and be valued separately by the investment community, potentially resulting in an increase in equity value that would benefit each of the businesses in executing its strategy Pure - play equity currency ▪ Each company would be able to attract and retain world - class talent by offering meaningful equity - based compensation that correlates closely to performance ▪ Each company’s ability to pursue accretive M&A would be enhanced with the benefit of an independent equity currency at a potentially higher value Currently expected to close in second half 2021

INVESTOR PRESENTATION MAY 2021 Highly skilled management team 42 Brad Jacobs Chief Executive Officer United Rentals, United Waste Aroon Amarnani Vice President, Strategy TIAA, Barclays Capital Josephine Berisha Chief Human Resources Officer Morgan Stanley Tony Brooks President, Less - Than - Truckload – North America Sysco, PepsiCo, Roadway Erik Caldwell President, Last Mile Logistics Hudson's Bay, Luxottica Richard Cawston Managing Director, Supply Chain – Europe Norbert Dentressangle , Asda Ashfaque Chowdhury President, Supply Chain – Americas and Asia Pacific New Breed Troy Cooper President United Rentals, United Waste Matthew Fassler Chief Strategy Officer Goldman Sachs Bill Fraine Division President, Sales and Operations, Supply Chain – Americas and Asia Pacific New Breed, FedEx Luis - Angel Gómez Izaguirre Managing Director, Transport – Europe Norbert Dentressangle Maryclaire Hammond Senior Vice President, Human Resources BP, Honeywell Mario Harik Chief Information Officer Oakleaf Waste Management Note: Partial list in alphabetical order LEADERSHIP PRIOR EXPERIENCE

INVESTOR PRESENTATION MAY 2021 Highly skilled management team (cont.) 43 Tavio Headley Vice President, Investor Relations Jefferies, American Trucking Associations LaQuenta Jacobs Chief Diversity Officer Delta Air Lines, Home Depot, Turner Broadcasting Katrina Liddell President, Global Forwarding and Expedite Johnson Controls International Mark Manduca Chief Investment Officer, Logistics Citigroup, Bank of America Merrill Lynch Baris Oran Chief Financial Officer, Logistics Sabanci Group, Kordsa Eduardo Pelleissone Chief Transformation Officer Kraft Heinz, America Latina Logistica Sandeep Sakharkar Senior Vice President, Logistics Technology Foot Locker, Johnson & Johnson Kevin Sterling Vice President, Strategy Seaport Global Securities, BB&T Ravi Tulsyan Deputy Chief Financial Officer and Treasurer ADT, Tyco, PepsiCo Drew Wilkerson President, Transportation – North America C.H. Robinson Malcolm Wilson Chief Executive Officer, XPO Logistics Europe Norbert Dentressangle , NYK Logistics Kyle Wismans Senior Vice President, Financial Planning and Analysis Baker Hughes, General Electric David Wyshner Chief Financial Officer Wyndham, Avis, Merrill Lynch LEADERSHIP PRIOR EXPERIENCE Note: Partial list in alphabetical order

INVESTOR PRESENTATION MAY 2021 Business glossary 44 XPO SERVICES ▪ Less - than - truckload (LTL): LTL is the transportation of a quantity of freight that is larger than a parcel but too small to require an entire truck, and is often shipped on a pallet. LTL shipments are priced according to the weight of the freight, its commodity c lass (generally determined by cube/weight ratio and type of product), and mileage within designated lanes. An LTL carrier typicall y o perates a hub - and - spoke network that allows for the consolidation of multiple shipments for different customers in single trucks. XPO is the third largest LTL provider in North America, with 290 terminals and over 75,000 next - day and two - day lanes. This network provide s customers with geographic density and day - definite regional, inter - regional and transcontinental LTL freight services, including cross - border US service to and from Mexico and Canada, and intra - Canada service. The company also has one of the largest LTL networks in Western Europe, using a blended model of owned and contracted capacity to provide customers with domestic and pan - European solutions, ▪ Logistics: Logistics is an asset - light business characterized by long - term contractual relationships with high renewal rates and low cyclicality. Contracts are typically structured as either fixed - variable, cost - plus or gain - share. XPO is the second largest con tract logistics provider in the world, with long - tenured customer relationships in diverse verticals, and customized solutions with hi gh - value - add components, such as advanced automation, that minimize commoditization. The company’s services include e - commerce fulfillment, reverse logistics, value - added warehousing and distribution, order personalization, cold - chain logistics, packaging and labeling, aftermarket support, inventory management and supply chain optimization for customers in aerospace, manufacturing, ret ail, life sciences, chemicals, food and beverage and cold - chain. Reverse logistics, also known as returns management, is a fast - growing area of logistics that refers to managing the flow of ret urned goods back through logistics facilities ⏤ typically unwanted or defective merchandise. The demand for returns management has increased dramatically along with e - commerce sales, as consumers often “test drive” products they buy online. Reverse logistics services can include cleaning, testing, inspection, refurbishment, restocking, warranty processing and refunding. ▪ Truck brokerage: Truck brokerage is a variable - cost business that facilitates the trucking of freight by procuring carriers through the use of proprietary technology, typically referred to as a TMS (transportation management system). Brokerage net revenue is th e spread between the price to the shipper and the cost of purchased transportation. The vast majority of truck brokerage shipme nts are full truckload: cargo is provided by a single shipper in an amount that requires the full limit of the trailer, either by dim ens ion or weight. XPO is the second largest freight broker globally and the third largest in North America. The company matches shippers’ loads wi th third - party carrier capacity ⏤ primarily provided by independent contractors with the ability to interact directly on the company’s proprietary XPO Connect Œ digital platform (see next page). Truck brokers have steadily increased their share of the for - hire trucking market throughout cycles, and shippers increasingly value automation, making digital truck brokerage one of the strongest tre nds in the transportation industry.
INVESTOR PRESENTATION MAY 2021 Business glossary (cont.) 45 XPO TECHNOLOGY ▪ XPO Connect Œ : XPO’s proprietary, fully automated, self - learning digital freight marketplace connects shippers and carriers directly, as well as through company operations. XPO Connect Œ gives shippers comprehensive visibility into current market conditions, including fluctuations in capacity, spot rates by geography and digital negotiating through an automated counteroffer feature . C arriers can post available truck capacity and bid on loads, and shippers can tender loads and track their freight in real time. Drive rs use the Drive XPO Œ app for mobile access to XPO Connect Œ from the road. The app also serves as a geo - locator and supports voice - to - text communications. The cloud - based XPO Connect Œ platform is deployed in North America and Europe. ▪ XPO Direct Œ : XPO’s national, shared - space distribution network gives retail, e - commerce, omnichannel and manufacturing customers new ways to distribute their goods. XPO Direct Œ warehouses serve as stockholding sites and cross - docks that can be utilized by multiple customers at the same time. B2C and B2B customers “rent” XPO’s logistics capacity, labor, technology, transportation and storage to reposition inventories fluidly across markets as demand fluctuates without the capital investme nt of adding distribution centers. The XPO Direct Œ network uses XPO’s existing assets and supplier relationships as growth levers, capturing incremental business by positioning customer inventories within one or two - day ground delivery of approximately 99% of the US population. ▪ XPO Smart Œ : XPO’s proprietary, intelligent optimization tools improve labor productivity, warehouse management and demand forecasting in the company’s logistics and transportation operations. In the company’s logistics business, XPO Smart Œ interfaces with the XPO’s proprietary warehouse management platform to forecast optimal labor levels day - by - day and shift - by - shift, showing the future impact of current decisions. In the transportation business, XPO Smart Œ is utilized in the company’s less - than - truckload operations to improve cross - dock productivity at LTL network terminals.

INVESTOR PRESENTATION MAY 2021 Potential profit growth opportunity of ~$700 million to $1 billion 46 Pricing benefits 20% New business initiatives 20% Cost initiatives 60% Revenue initiatives POOL OF COST OPPORTUNITIES ▪ XPO Smart Ρ optimization of ~$5 billion of variable labor cost ▪ Greater efficiencies in LTL linehaul and pickup - and - delivery spend ▪ Continued logistics automation ▪ European logistics margin expansion ▪ Global procurement savings ▪ Further back - office optimization POOL OF REVENUE OPPORTUNITIES ▪ Advanced pricing analytics and revenue tools ▪ XPO Connect Ρ digital freight marketplace ▪ XPO Direct Ρ shared distribution network ▪ Focused selling to European strategic accounts INITIATIVES AS % OF TOTAL XPO - SPECIFIC OPPORTUNITY XPO will continue to analyze these and other opportunities to ensure that resources are focused on endeavors that potentially can return the most value. XPO is executing on 10 profit initiatives that are all self - driven and largely independent of the macro. In total, these initiatives represent a potential $700 million to $1 billion profit improvement run rate in 2023. XPO continued to make progress with these initiatives throughout 2020 and into 2021, due in large part to the company - specific benefits of its proprietary technology developed for transportation and logistics. The profit improvement opportunity range provided above is expected to apply to current operations as follows: ~50% benefit to global logistics; ~30% benefit to North American LTL; and ~20% benefit to all other transportation lines.

INVESTOR PRESENTATION MAY 2021 ▪ XPO is the largest last mile provider for heavy goods ▪ Customers include omnichannel retail, e - commerce and direct - to - consumer manufacturers ▪ Asset - light platform positioned within 125 miles of 90% of the US population; independent contractor network ▪ Consistently high satisfaction levels supported by digital consumer engagement via XPO technology ▪ XPO Connect Œ tools balance route efficiency with consumer at - home availability Additional service: Last mile logistics for heavy goods 47 Revenue TTM March 31, 2021 $953 million Hub locations 85 Team members 2 ~2,800 Carriers / trucks ~1,800 / ~4,000 Deliveries and installations per year Over 10 million 1 Source: Third - party research 2 ~1,800 employees and ~1,000 temporary workers INDUSTRY LEADER IN NORTH AMERICA XPO KEY METRICS 135 138 161 190 220 250 287 328 377 435 493 567 707 818 957 1,104 1,249 2008A 2009A 2010A 2011A 2012A 2013A 2014A 2015A 2016A 2017A 2018A 2019A 2020E 2021E 2022E 2023E 2024E Accelerating growth of e - commerce includes trend toward more big and bulky goods bought online US e - commerce, $ in billions Last mile logistics is the facilitation of deliveries to consumer homes, often with white - glove service. XPO specializes in last mile logistics for heavy goods, such as appliances, furniture and large electronics. North American industry size: ~ $13 billion 1 .

INVESTOR PRESENTATION MAY 2021 XPO is widely recognized for performance and culture 48 ▪ Named one of the World’s Most Admired Companies by Fortune, 2018, 2019, 2020, 2021 ▪ Ranked #1 in the Fortune 500 category of Transportation and Logistics, 2017, 2018, 2019, 2020 ▪ Awarded silver CSR rating in Europe by EcoVadis for transportation and logistics, 2019, 2020 ▪ Named one of Spain’s Best Companies to Work For by Forbes, 2019, 2020, 2021 ▪ Awarded Apprenticeship of the Year in the UK by Motor Transport, 2020 ▪ Ranked #3 of Top 125 3PLs in France by Supply Chain Magazine, 2020 ▪ Received Innovation Award for partnership with Wavin Manufacturing at Supply Chain Excellence Awards, 2020 ▪ Winner of Dow Chemical’s Sustainability Award for road transportation, 2021 ▪ Named LTL Collaborator of the Year by GlobalTranz , 2021 ▪ Ranked #3 of Top 100 Logistics Providers in the Netherlands by Logistiek , 2020 ▪ Recognized as one of the Most Socially Responsible Companies in France by Statista, 2020 ▪ Honored with Whirlpool Corporation Intermodal Carrier of the Year Award and Maytag Dependability Award for reverse logistics, 20 20 ▪ CEO Brad Jacobs named one of the Top 10 Logistics Leaders by Supply Chain Digital, 2020 ▪ Ranked Logistics Solution Provider of the Year by Urban Transport News in India, 2020 ▪ Received Torres & Earth Award in Spain for making positive contributions to combat climate change, 2020 ▪ Ranked #7 of the Top 20 UK Companies for Quality of Workplace Culture by the Chartered Management Institute, 2020 ▪ Ranked in top three of the Top 100 Transport Companies in France by l’Officiel des Transporteurs , 2019, 2020 ▪ Recognized by Ford Motor Company with World Excellence Awards, 2019 silver - level, 2020 gold - level ▪ Recognized by Owens Corning as Supplier of the Year Award, 2020 ▪ Named a European Diversity Leader by the Financial Times, 2019 ▪ Named a Leader in the Magic Quadrant for 3PL Providers by Gartner, 2018, 2019, 2020 (worldwide) ▪ Recognized by General Motors with Supplier of the Year Award for aftermarket distribution 2019, managed transportation 2020 ▪ XPO Connect Œ received SDCE 100 Award for Innovation from Supply & Demand Chain Executive, 2020 ▪ Partnering with MIT as the first global logistics company to join the Industrial Liaison Program, 2019, 2020 Continued on next page
INVESTOR PRESENTATION MAY 2021 XPO is widely recognized for performance and culture (cont.) 49 ▪ Ranked in top 100 of America's Most Responsible Companies by Newsweek, 2019 ▪ Named a Winning “W” Company by 2020 Women on Boards for gender diversity of the board of directors, 2019 ▪ Named a Great Supply Chain Partner by Supply Chain Brain, 2020 ▪ Awarded Trucks & Roads Award in Russia for operational excellence, 2018, 2019, 2020 ▪ Named a Disruptive Technology Leader on the Freight.Tech 25 by FreightWaves , 2019 ▪ Recognized by Raytheon Company with EPIC Supplier Excellence Award for on - time delivery, 2019 ▪ Recognized by Nissan Manufacturing UK for excellence at Operational Logistics Awards, 2014, 2015, 2016, 2017, 2018, 2019 ▪ Recognized by Boeing Company with Performance Excellence Award, 2018 ▪ Ranked #1 on Transport Topics Top 50 Logistics list, 2017, 2018, 2019, 2020 ▪ Named a Top 100 3PL by Inbound Logistics, 2014, 2015, 2016, 2017, 2018, 2019, 2020 ▪ Recognized by Supply Chain Magazine with an Innovation Award at Kings of the Supply Chain in France, 2020 ▪ Ranked #3 of the Glassdoor Top 20 UK companies with the best leadership and culture, 2018, 2019 ▪ Named to the Fortune Future 50 list of US companies best positioned for breakout growth, 2018 ▪ Awarded Best Employer Practice Award for partnership with DS Workfit by British Association for Supported Employment, 2019 ▪ Awarded a Trucks and Roads Award in Russia, 2018, 2019 ▪ CEO Jacobs ranked #10 on Barron's readers list of World's Best CEOs, 2018 ▪ Awarded Company of the Year for innovation by Assologistica (Italy), 2017, 2018, 2019
INVESTOR PRESENTATION MAY 2021 Select highlights of XPO’s people - first culture 50 ▪ XPO’s US warehouse safety record for OSHA reportable incidents is more than four times better than industry average ▪ Road to Zero program helped decrease the percentages of distracted driving, lost work days and crashes by double digits in 20 20 ▪ Appointed a Chief Diversity Officer and launched a Diversity and Inclusion Council in 2020 ▪ Launched a Sustainability Steering Committee and a Diversity and Inclusion Steering Committee in Europe in 2020 ▪ Named 2021 transportation partner of 3 - Day Walks ® for Susan G. Komen Foundation in its fight against breast cancer ▪ Partnered with Hispanic Association of Colleges and Universities to provide financial support for HACU’s objectives ▪ Partnered with Truckers Against Trafficking to help combat human trafficking ▪ Recognized by Human Rights Campaign on the Corporate Equality Index (CEI) for LGBTQ+ inclusion, 2020, 2021 ▪ Donated global logistics services to Soles4Souls, a non - profit committed to disrupting the cycle of poverty ▪ Partnered with a leading virtual clinic for women and families to provide supplemental health services for employees ▪ Tuition benefit reimburses employees up to $5,250 annually for pursuing continuing education ▪ Robust recruitment initiatives emphasize diversity hiring; awarded Viqtory’s bronze - level Military - Friendly Employer ® ▪ Company celebrates Black History, Women’s History, Hispanic Heritage, Pride and Military Appreciation months ▪ 300 young people hired to date by XPO Logistics in Europe through the XPO Graduate Program Progressive Pregnancy Care and Family Bonding benefits ▪ Any XPO employee, male or female, receives up to six weeks of 100% paid postnatal leave as primary caregiver; women receive u p to 20 days of 100% paid prenatal leave for health and wellness ▪ “Automatic yes" pregnancy accommodations granted on request; more extensive accommodations easily arranged ▪ XPO guarantees that a woman will continue to be paid her regular base wage rate, and remain eligible for wage increases, whil e h er pregnancy accommodations are in effect XPO’s latest Sustainability Report is available online at sustainability.xpo.com
INVESTOR PRESENTATION MAY 2021 Strongly committed to sustainability in transportation and logistics 51 TRANSPORTATION ▪ Named a Top 75 Green Supply Chain Partner by Inbound Logistics for 2016, 2017, 2018, 2019, 2020 ▪ Awarded Trophées EVE 2020 for implementing an “urban river” solution to reduce CO 2 emissions during inner - city deliveries in Paris, in cooperation with the Ports of Paris, City of Paris, Île - de - France region and Voies Navigables de France ▪ Renewed three - year commitment to the CO 2 Charter in France, extending 10 - year commitment to sustainability ▪ Expanded fleet with 80 liquified natural gas (LNG) trucks in Europe in 2020; now over 250 natural gas trucks in Europe ▪ Invested in fuel - efficient Freightliner Cascadia tractors in North America (EPA - compliant and GHG14 - compliant technology), and Stralis Natural Power Euro VI tractors in Europe ▪ European fleet has reduced fuel consumption by 10% since 2015 ▪ Partnered with ENGIE Solutions, a leading provider of sustainable mobility, to transport natural gas in cryogenic tanks capab le of maintaining extremely low temperatures ▪ Mega - trucks in Spain can reduce CO 2 emissions by up to 20%; tested duo - trailer for Ministry of Transport ▪ XPO drivers train in responsible eco - driving and fuel usage reduction techniques ▪ North American LTL locations implementing phased upgrades to LED lighting ▪ Experimenting in Europe with diesel - electric hybrids and zero - emission electric vans for last mile service CarbonNET , our proprietary, cloud - based calculator, helps our operations document emission sources, activity data and CO 2 calculations

INVESTOR PRESENTATION MAY 2021 Strongly committed to sustainability in transportation and logistics (cont.) 52 LOGISTICS ▪ XPO’s Digital Distribution Warehouse of the Future for Nestlé in the UK is an environmentally advanced facility, with ammonia refrigeration, LED lighting, air - source heat pumps and a rainwater harvesting system ▪ Numerous XPO facilities are ISO14001 - certified to high standards for environmental management ▪ XPO has equipped close to 50% of its total space in Europe with LED lighting systems, which has already saved approximately 2 ,50 0 tons of CO 2 ▪ Nearly 75% of XPO’s total space in Europe are expected to operate LED lighting systems by year - end 2021 ▪ Polystyrene recycling initiative launched in France in partnership with Envie , an organization that gets vulnerable people back to work; recognized with the Sustainable Industry Award by L'Usine Nouvelle ▪ Long - time partner of EPA SmartWay ® Logistics in North America; EPA’s Energy Star Warehouse Leadership Group ▪ 96% of XPO’s logistics sites are eligible for the EPA’s Stormwater No Exposure Certification ▪ Obtained Ecocert Organic Certification for temperature - controlled logistics warehouses in France, 2019 ▪ Defined greenhouse gas and landfill reduction targets for North American logistics and drafted procedures to address sustaina ble procurement, greenhouse gas emissions, landfill diversion, natural resource conservation and energy efficiency ▪ Utilizing electronic waybills and documentation in global operations to reduce paper and other waste ▪ Energy efficiency evaluations performed prior to selecting warehouses to lease ▪ Vast majority of material handling devices used in logistics sites operate on battery power instead of fuel ▪ Millions of electronic components and batteries recycled annually as a byproduct of managing reverse logistics ▪ Packaging engineers ensure that optimal carton size is used for each product slated for distribution ▪ Reusable kitting tools manufactured by XPO utilized for installation of parts in customer operations

INVESTOR PRESENTATION MAY 2021 Appendix

INVESTOR PRESENTATION MAY 2021 Financial reconciliations 54 The following table reconciles XPO’s net income attributable to common shareholders for the periods ended March 31, 2021 and 2020 to adjusted EBITDA for the same periods. 1 Relates to the Series A Preferred Stock and is comprised of actual preferred stock dividends and the non - cash allocation of und istributed earnings 2 Adjusted EBITDA includes North American less - than - truckload real estate gains of $17 million and $27 million for the three mont hs ended March 31, 2021 and 2020, respectively 3 Adjusted EBITDA margin is calculated as adjusted EBITDA divided by revenue. Note: Adjusted EBITDA was prepared assuming 100% ownership of XPO Logistics Europe Refer to the “Non - GAAP Financial Measures” section on page 2 of this document Change % Net income attributable to common shareholders $ 115 $ 21 447.6% Distributed and undistributed net income (1) - 2 Net income attributable to noncontrolling interests 3 2 Net income 118 25 372.0% Debt extinguishment loss 8 - Interest expense 69 72 Income tax provision 35 10 Depreciation and amortization expense 192 183 Unrealized gain on foreign currency option and forward contracts (1) (4) Transaction and integration costs 18 44 Restructuring costs 4 3 Adjusted EBITDA (2) $ 443 $ 333 33.0% Revenue $ 4,774 $ 3,864 23.6% Adjusted EBITDA margin (3) 9.3% 8.6% Three Months Ended March 31, 2021 2020 XPO LOGISTICS, INC. RECONCILIATION OF NET INCOME TO ADJUSTED EBITDA (Unaudited) (In millions)
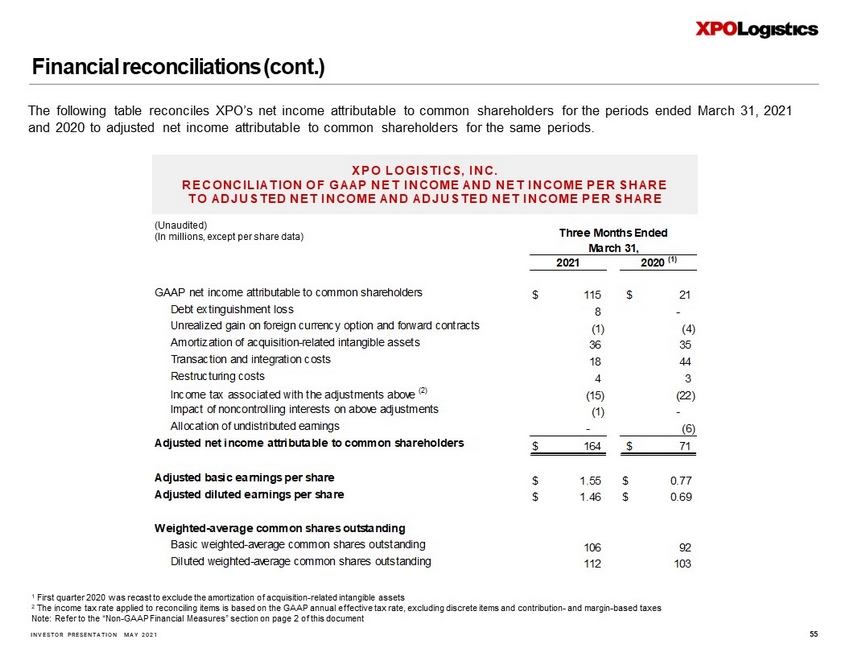
INVESTOR PRESENTATION MAY 2021 GAAP net income attributable to common shareholders $ 115 $ 21 Debt extinguishment loss 8 - Unrealized gain on foreign currency option and forward contracts (1) (4) Amortization of acquisition-related intangible assets 36 35 Transaction and integration costs 18 44 Restructuring costs 4 3 Income tax associated with the adjustments above (2) (15) (22) Impact of noncontrolling interests on above adjustments (1) - Allocation of undistributed earnings - (6) Adjusted net income attributable to common shareholders $ 164 $ 71 Adjusted basic earnings per share $ 1.55 $ 0.77 Adjusted diluted earnings per share $ 1.46 $ 0.69 Weighted-average common shares outstanding Basic weighted-average common shares outstanding 106 92 Diluted weighted-average common shares outstanding 112 103 March 31, Three Months Ended 2021 2020 (1) Financial reconciliations (cont.) 55 1 First quarter 2020 was recast to exclude the amortization of acquisition - related intangible assets 2 The income tax rate applied to reconciling items is based on the GAAP annual effective tax rate, excluding discrete items and c ontribution - and margin - based taxes Note: Refer to the “Non - GAAP Financial Measures” section on page 2 of this document The following table reconciles XPO’s net income attributable to common shareholders for the periods ended March 31, 2021 and 2020 to adjusted net income attributable to common shareholders for the same periods. XPO LOGISTICS, INC. RECONCILIATION OF GAAP NET INCOME AND NET INCOME PER SHARE TO ADJUSTED NET INCOME AND ADJUSTED NET INCOME PER SHARE (Unaudited) (In millions, except per share data)
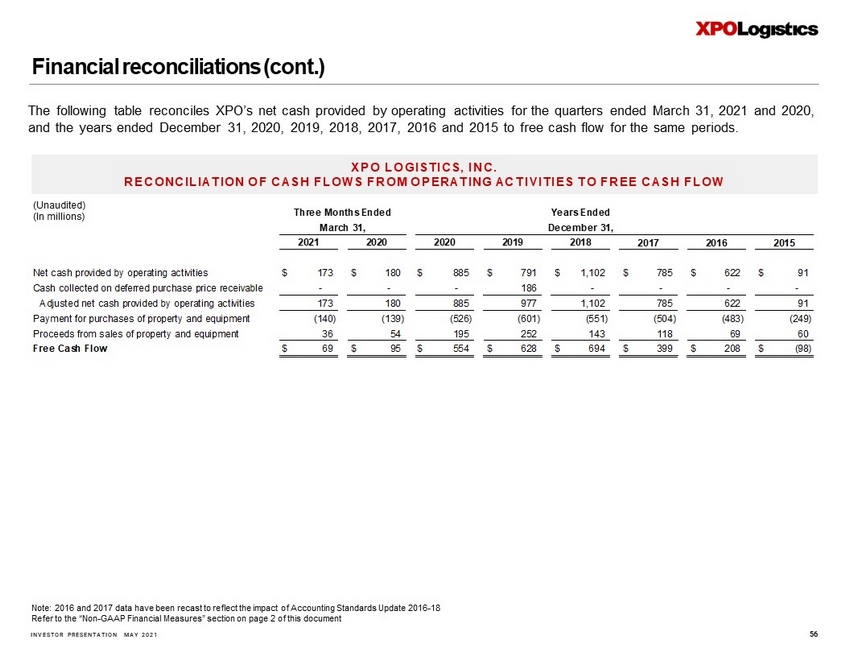
INVESTOR PRESENTATION MAY 2021 Financial reconciliations (cont.) 56 Note: 2016 and 2017 data have been recast to reflect the impact of Accounting Standards Update 2016 - 18 Refer to the “Non - GAAP Financial Measures” section on page 2 of this document The following table reconciles XPO’s net cash provided by operating activities for the quarters ended March 31, 2021 and 2020 , and the years ended December 31, 2020, 2019, 2018, 2017, 2016 and 2015 to free cash flow for the same periods. Net cash provided by operating activities $ 173 $ 180 $ 885 $ 791 $ 1,102 $ 785 $ 622 $ 91 Cash collected on deferred purchase price receivable - - - 186 - - - - Adjusted net cash provided by operating activities 173 180 885 977 1,102 785 622 91 Payment for purchases of property and equipment (140) (139) (526) (601) (551) (504) (483) (249) Proceeds from sales of property and equipment 36 54 195 252 143 118 69 60 Free Cash Flow $ 69 $ 95 $ 554 $ 628 $ 694 $ 399 $ 208 $ (98) March 31, Years Ended December 31, 2020 2019 2016 2021 2018 2017 2020 2015 Three Months Ended XPO LOGISTICS, INC. RECONCILIATION OF CASH FLOWS FROM OPERATING ACTIVITIES TO FREE CASH FLOW (Unaudited) (In millions)

INVESTOR PRESENTATION MAY 2021 Financial reconciliations (cont.) 57 The following table reconciles XPO’s operating income attributable to its North American less - than - truckload business for the quarters ended March 31 2021 and 2020, and for the years ended December 31, 2020, 2019, 2018, 2017, 2016 and 2015 to adjusted operating income, adjusted operating ratio and adjusted EBITDA for the same periods. 1 Operating income, adjusted operating income and adjusted EBITDA include real estate gains of $17 million and $27 million for the three months ended March 31, 2021 and 2020, respectively 2 Operating ratio is calculated as (1 - (operating income divided by revenue)) 3 Other income primarily consists of pension income 4 Adjusted operating ratio is calculated as (1 - (Adjusted operating income divided by Revenue)). Adjusted operating margin is th e inverse of adjusted operating ratio 5 Excluding impact of gains on real estate transactions from both periods, adjusted operating ratio improved by 220 basis point s from 86.5% in the first quarter of 2020 to 84.3% in the first quarter of 2021 Note: Refer to the “Non - GAAP Financial Measures” section on page 2 of this document Revenue (excluding fuel surcharge revenue) $ 827 $ 775 $ 3,106 $ 3,259 $ 3,230 $ 3,140 $ 3,035 $ 3,081 Fuel surcharge revenue 135 123 433 532 552 455 370 448 Revenue 962 898 3,539 3,791 3,782 3,595 3,405 3,529 Salaries, wages and employee benefits 453 437 1,748 1,786 1,754 1,697 1,676 1,741 Purchased transportation 94 87 334 397 400 438 438 508 Fuel and fuel-related taxes 63 57 186 264 293 234 191 230 Other operating expenses 134 118 495 471 590 574 538 635 Depreciation and amortization 55 56 224 227 243 233 203 164 Rents and leases 18 15 65 49 44 42 41 49 Operating income (1) 145 128 487 597 458 377 318 202 Operating ratio (2) 84.9% 85.7% 86.2% 84.3% 87.9% 89.5% 90.7% 94.3% Transaction, integration and rebranding costs - 2 5 - - 19 24 21 Restructuring costs - - 4 3 3 - - - Amortization expense 8 8 34 34 33 34 34 10 Other income (3) 14 11 43 22 29 12 - - Depreciation adjustment from updated purchase price allocation of acquired assets - - - - - - (2) - Adjusted operating income (1) $ 167 $ 149 $ 573 $ 656 $ 523 $ 442 $ 374 $ 233 Adjusted operating ratio (4) (5) 82.6% 83.4% 83.8% 82.7% 86.2% 87.7% 89.0% 93.4% Depreciation expense 47 48 190 193 210 199 169 154 Other - - 1 2 - 6 4 (6) Adjusted EBITDA (1) $ 214 $ 197 $ 764 $ 851 $ 733 $ 647 $ 547 $ 381 2015 Years Ended December 31, 2021 2020 Three Months Ended March 31, 20162020 2019 2018 2017 RECONCILIATION OF NON - GAAP MEASURES XPO LOGISTICS NORTH AMERICAN LESS - THAN - TRUCKLOAD ADJUSTED OPERATING RATIO AND ADJUSTED EBITDA (Unaudited) (In millions)
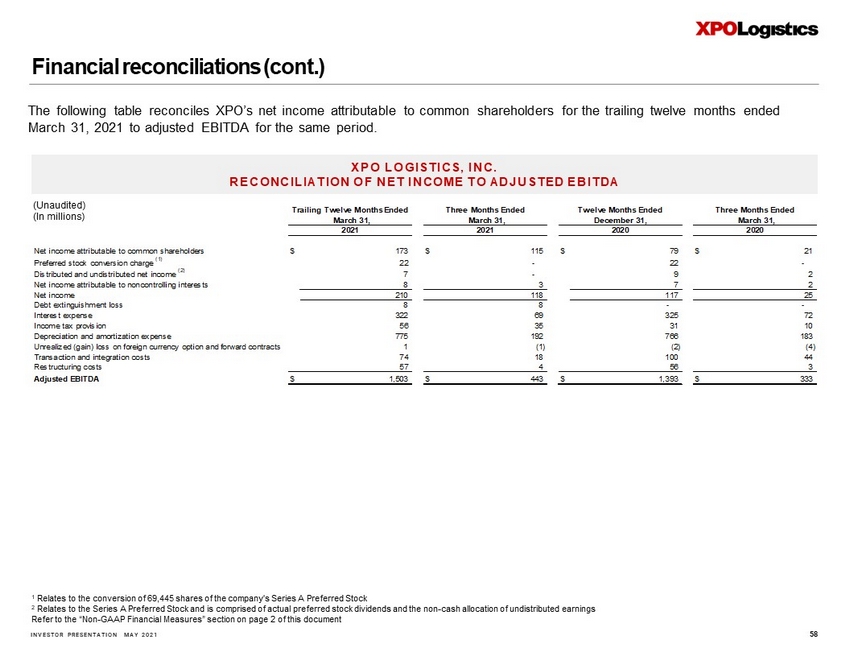
INVESTOR PRESENTATION MAY 2021 Financial reconciliations (cont.) 58 1 Relates to the conversion of 69,445 shares of the company's Series A Preferred Stock 2 Relates to the Series A Preferred Stock and is comprised of actual preferred stock dividends and the non - cash allocation of und istributed earnings Refer to the “Non - GAAP Financial Measures” section on page 2 of this document The following table reconciles XPO’s net income attributable to common shareholders for the trailing twelve months ended March 31, 2021 to adjusted EBITDA for the same period. Net income attributable to common shareholders $ 173 $ 115 $ 79 $ 21 Preferred stock conversion charge (1) 22 - 22 - Distributed and undistributed net income (2) 7 - 9 2 Net income attributable to noncontrolling interests 8 3 7 2 Net income 210 118 117 25 Debt extinguishment loss 8 8 - - Interest expense 322 69 325 72 Income tax provision 56 35 31 10 Depreciation and amortization expense 775 192 766 183 Unrealized (gain) loss on foreign currency option and forward contracts 1 (1) (2) (4) Transaction and integration costs 74 18 100 44 Restructuring costs 57 4 56 3 Adjusted EBITDA $ 1,503 $ 443 $ 1,393 $ 333 March 31, March 31, December 31, March 31, 2021 2021 2020 2020 Trailing Twelve Months Ended Three Months Ended Twelve Months Ended Three Months Ended XPO LOGISTICS, INC. RECONCILIATION OF NET INCOME TO ADJUSTED EBITDA (Unaudited) (In millions)
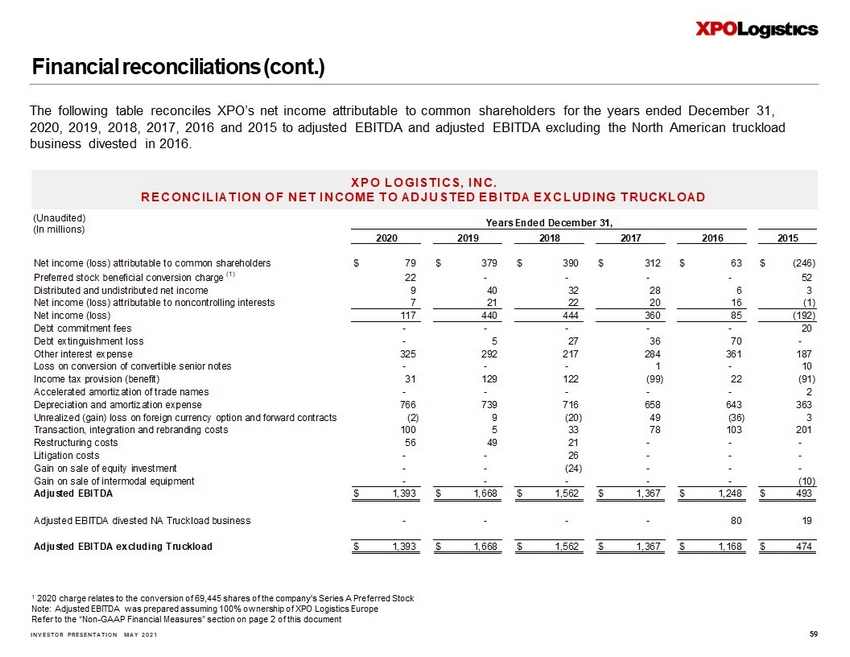
INVESTOR PRESENTATION MAY 2021 Financial reconciliations (cont.) 59 1 2020 charge relates to the conversion of 69,445 shares of the company's Series A Preferred Stock Note: Adjusted EBITDA was prepared assuming 100% ownership of XPO Logistics Europe Refer to the “Non - GAAP Financial Measures” section on page 2 of this document The following table reconciles XPO’s net income attributable to common shareholders for the years ended December 31, 2020, 2019, 2018, 2017, 2016 and 2015 to adjusted EBITDA and adjusted EBITDA excluding the North American truckload business divested in 2016. Net income (loss) attributable to common shareholders $ 79 $ 379 $ 390 $ 312 $ 63 $ (246) Preferred stock beneficial conversion charge (1) 22 - - - - 52 Distributed and undistributed net income 9 40 32 28 6 3 Net income (loss) attributable to noncontrolling interests 7 21 22 20 16 (1) Net income (loss) 117 440 444 360 85 (192) Debt commitment fees - - - - - 20 Debt extinguishment loss - 5 27 36 70 - Other interest expense 325 292 217 284 361 187 Loss on conversion of convertible senior notes - - - 1 - 10 Income tax provision (benefit) 31 129 122 (99) 22 (91) Accelerated amortization of trade names - - - - - 2 Depreciation and amortization expense 766 739 716 658 643 363 Unrealized (gain) loss on foreign currency option and forward contracts (2) 9 (20) 49 (36) 3 Transaction, integration and rebranding costs 100 5 33 78 103 201 Restructuring costs 56 49 21 - - - Litigation costs - - 26 - - - Gain on sale of equity investment - - (24) - - - Gain on sale of intermodal equipment - - - - - (10) Adjusted EBITDA $ 1,393 $ 1,668 $ 1,562 $ 1,367 $ 1,248 $ 493 Adjusted EBITDA divested NA Truckload business - - - - 80 19 Adjusted EBITDA excluding Truckload $ 1,393 $ 1,668 $ 1,562 $ 1,367 $ 1,168 $ 474 20152018 20162020 Years Ended December 31, 20172019 XPO LOGISTICS, INC. RECONCILIATION OF NET INCOME TO ADJUSTED EBITDA EXCLUDING TRUCKLOAD (Unaudited) (In millions)